

Market Data

February 10, 2016
Shipments and Supply of Sheet Products through December 2015
Written by Peter Wright
This report summarizes total steel supply annually from 2007 through 2015 and year on year changes. It then compares domestic mill shipments and total supply to the market. It quantifies market direction by product and enables a side by side comparison of the degree to which imports have absorbed demand. Sources are the American Iron and Steel Institute and the Department of Commerce with analysis by SMU.
Table 1 shows total supply, imports and import market share for nine years.
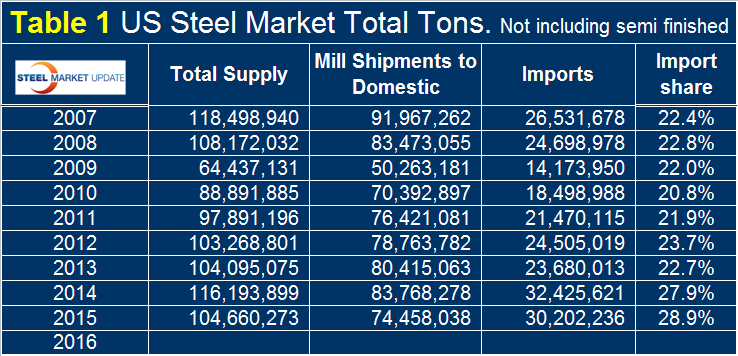
Through the lens of 2015, 2014 looks like a good year with the best supply (a proxy for market demand) picture since 2008. Total supply in 2015 was 104.7 million short tons, down from 116.2 million in 2014 but still the 2nd best year since 2008. It didn’t feel like it partly because import market share at 28.9 percent was the highest in over nine years. Table 2 shows the year/year change for 12 month totals since 2007.
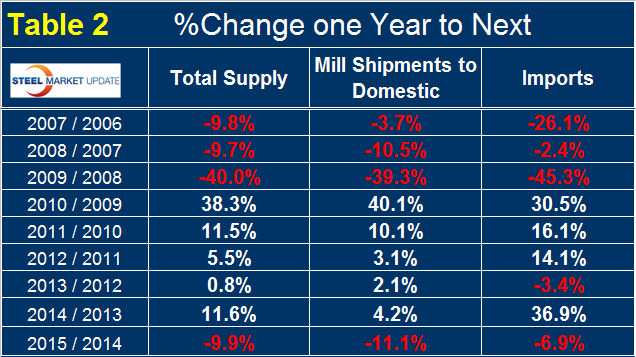
The actual volume of imports not including semi-finished in 2015 was down 6.9 percent even as import market share increased. Total supply including imports was down by 9.9 percent.
Table 3 shows both supply and mill shipments of sheet products (shipments includes exports) side by side as a three month average for the periods October through December (Q4) for both 2014 and 2015.
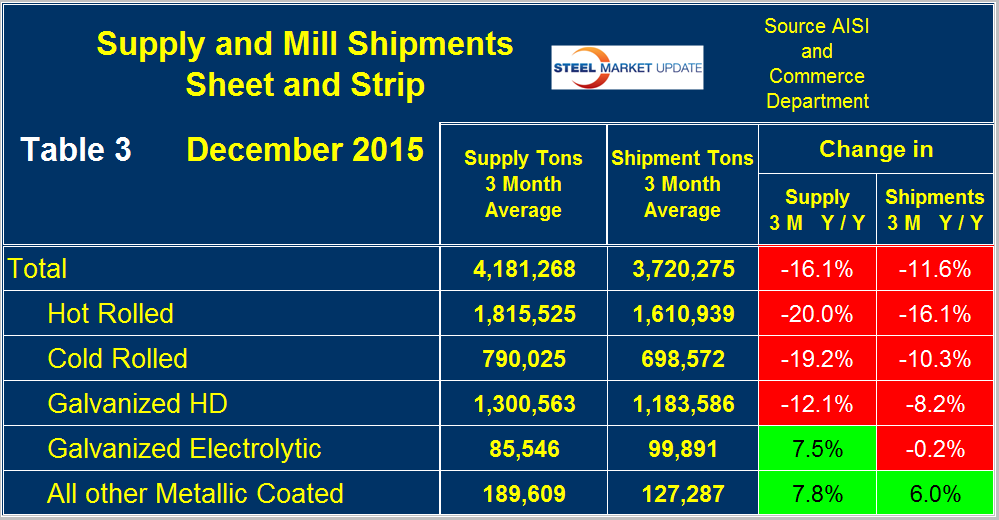
Comparing these two periods total supply to the market was down by 16.1 percent and shipments were down by 11.6 percent. The fact that supply was down by more than shipments means that imports put less pressure on the market than they did in most of 2015. Table 3 breaks down the total into the individual sheet products and it can be seen that for the big three items, HR, CR and HDG, shipments all fared better than supply. Supply of hot rolled was down by 20.0 percent and shipments were down by 16.1 percent, cold rolled supply was down by 19.2 percent as shipments were down by 10.3 percent. HDG supply was down by 12.1 percent as shipments declined 8.2 percent. This means that in all three cases imports gave up some ground. Electro-galvanized lost ground to imports as supply was up by 7.5 percent and shipments were flat. Electro-galvanized enjoys a trade surplus which weakened in December. Other metallic coated products (mainly Galvalume) bucked the trend and continued to have positive growth in both supply and shipments with 7.8 percent and 6.0 percent respectively. A review of supply and shipments separately for individual sheet products is given below.
Apparent Supply
Apparent Supply is a proxy for market demand and is defined as domestic mill shipments to domestic locations plus imports. In three months through December 2015 the average monthly supply of sheet and strip was 4.2 million tons, down by 16.1 percent year over year as mentioned above. In the last three months supply was down by 10.7 percent compared to Q3, July through September and down by 7.5 percent for the year as a whole. The short term decline (3 months) is less than the long term (12 months) which means that the decline is slowing. Table 4 shows the change in supply by product on this basis through December.
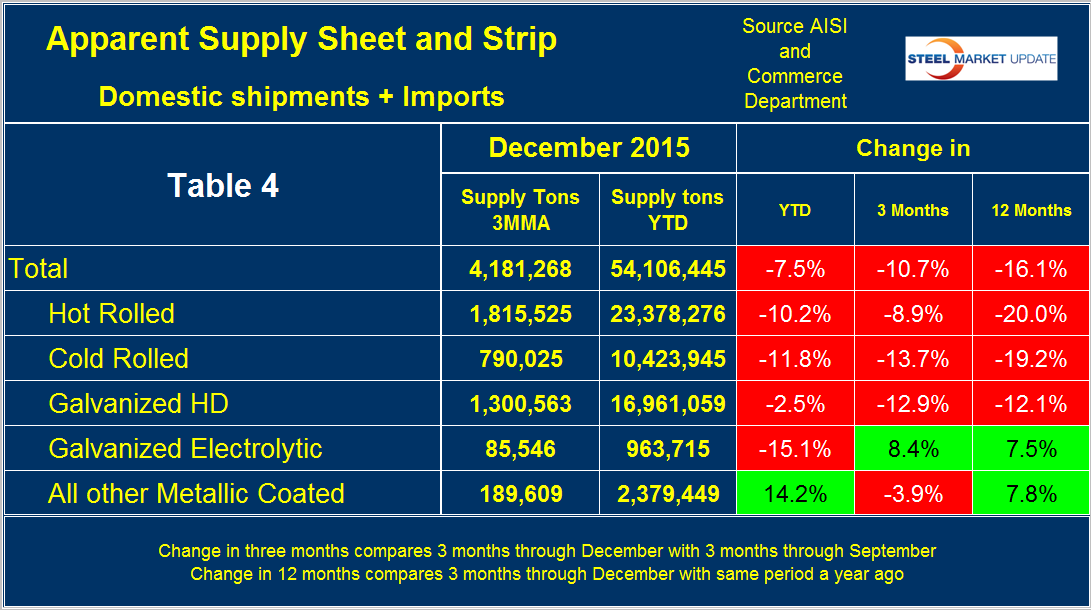
The reason the YTD figures are different from the 12 month y/y figures is that the latter only considers the three months through December. There is a big difference between products. Galvalume looks good in the YTD and 12 month comparisons but lost some ground in Q4/Q3. HR, CR and HDG declined in all three time comparisons though for HR and CR the decline is slowing.
Figure 1 shows the long term supply picture for the three major sheet and strip products, HR, CR and HDG since January 2003 as three month moving averages. All three declined in the last three months
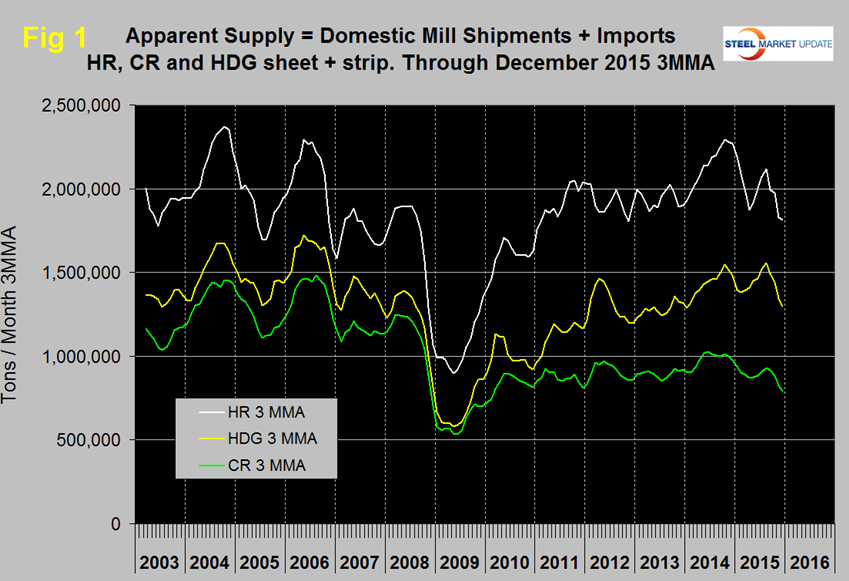
Figure 2 shows import market share of sheet products and includes long products for comparison.
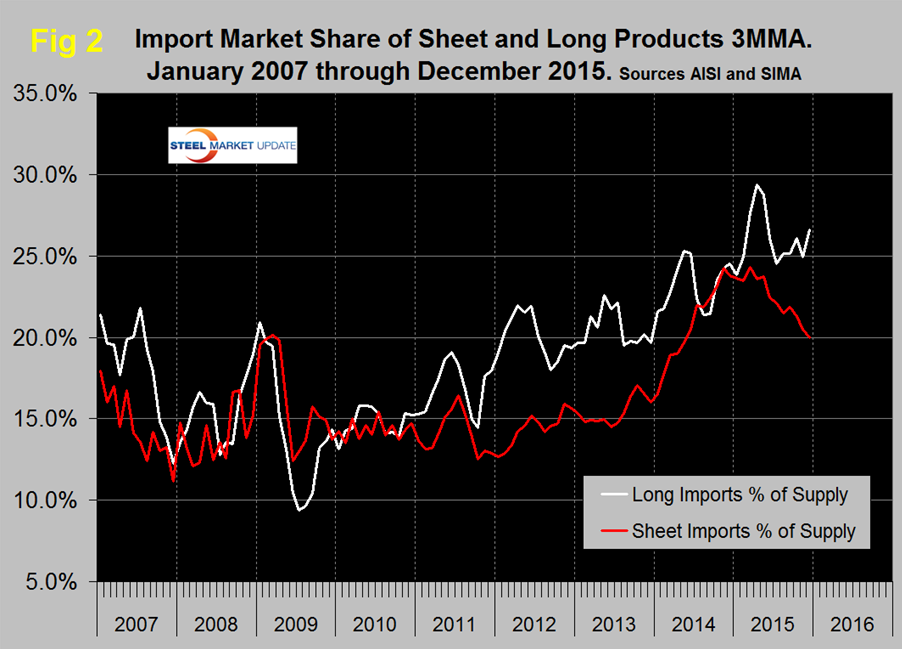
Based on a 3MMA the import market share of sheet products has declined more or less continuously since March 2015 when it was 24.3 percent to 20.0 percent in December. Import market share of long products in December was 26.6 percent, the highest number since May and has been trending up for seven years.
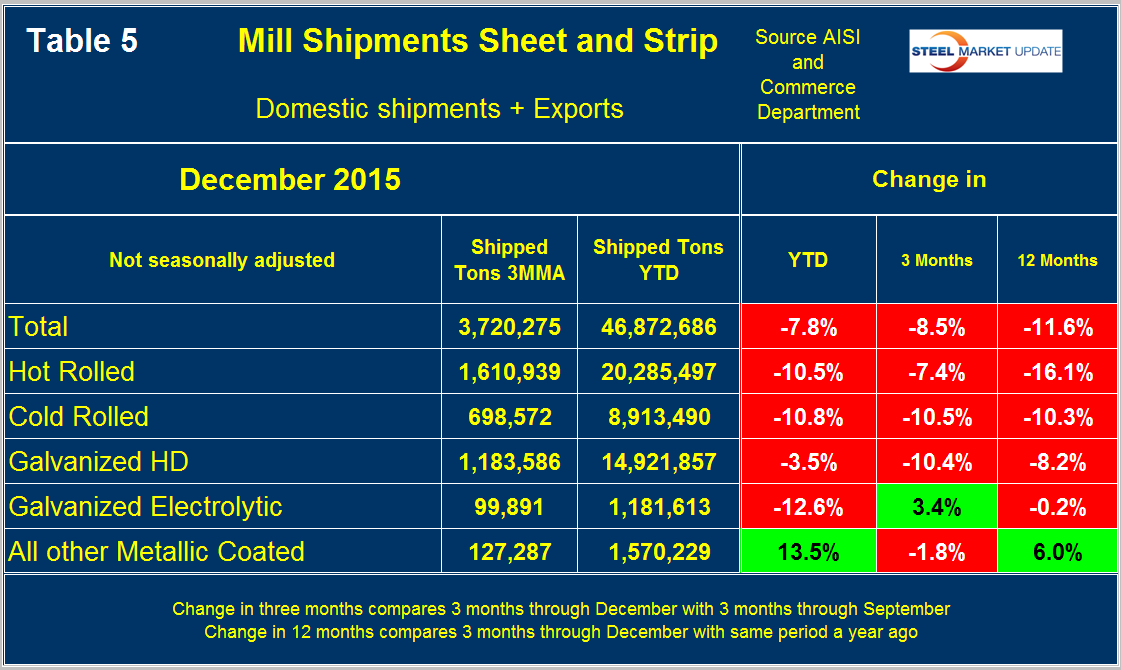
Mill Shipments
Table 5 shows that total shipments of sheet and strip products including hot rolled, cold rolled and all coated products were down by 11.6 percent in 3 months through December year over year and down by 8.5 percent comparing three months through December with three months through September.
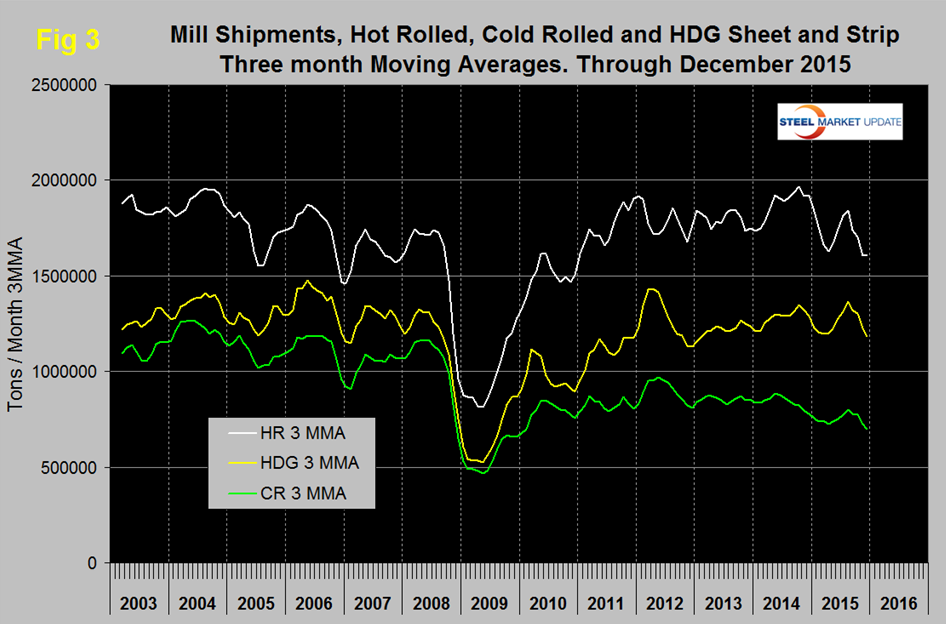
All the numbers in this report illustrate why it’s necessary to look at different time periods to get the whole picture. Individual products performed quite differently with other metallic coated faring the best. Figure 3 puts the results for the three main products into the long term context since January 2003.
SMU Comment: November as a single month was terrible for both shipments and supply of sheet products and December wasn’t much better. This was somewhat obscured by our 3MMA analysis which if January continues the trend will take a dive in our next report. We believe that manufacturing accounts for about 60 percent of steel consumption in the US and that figure is higher for sheet products than for longs. Import market share is still very high, longs being even worse than sheet products. However imports are no longer in the driver’s seat when it comes to absorbing market share. It is evident as we write many of the reports for publication in the Steel Market Update newsletters that it’s possible to slant an analysis anyway we want based on the time periods being examined. For that reason we always provide tabular data with quantitative short time period comparisons as well as graphical analysis of a much longer time frame. We hope this gives you the reader the best picture of what is going on.


