

Market Data

February 16, 2016
Oil and Gas Prices and Rotary Rig Count Analysis
Written by Peter Wright
On Monday there was a meeting between Russia and select OPEC members where they agreed to an oil output freeze at January levels in an effort to tackle a global supply glut. This was a closed door meeting in Doha between Saudi Arabia, Venezuela, Qatar and Russia. Evidently there was a caveat that other members should fall into line. Iran is one of the wild cards as discussed below.
Figure 1 shows historical oil and gas prices since January 2000. The daily spot price of West Texas Intermediate (WTI) closed at $29.71 February 8th down from $30.31 on January 25th, according to the latest daily figure available from the Energy Information Administration (EIA).
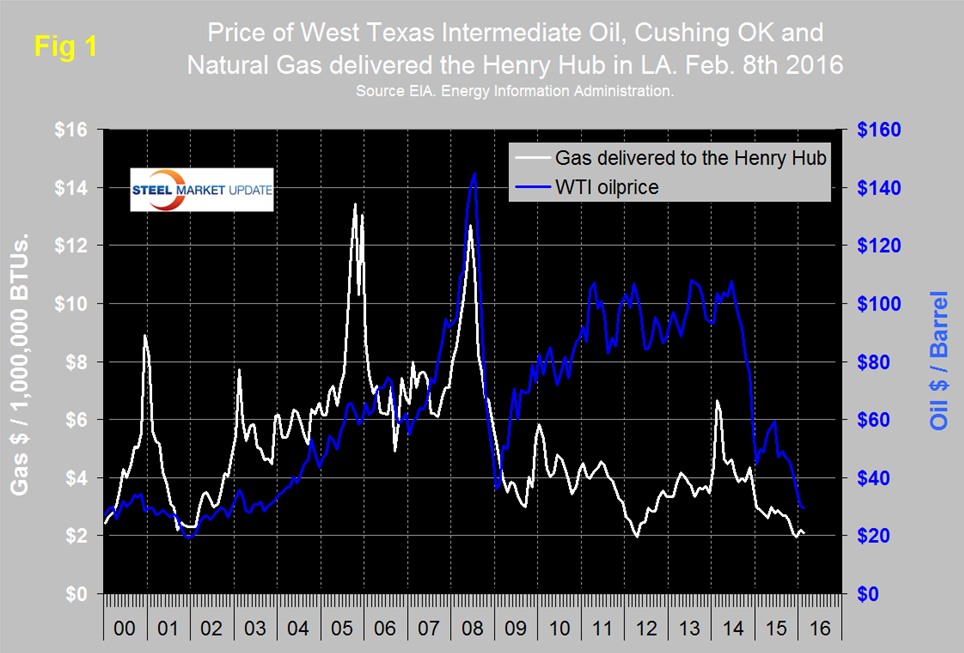
Brent closed at $31.64 on the same day. Since the price of oil began to drop in the second half of 2014, the Brent premium over WTI has moved progressively lower. The deal with Iran put additional pressure on Brent crude oil prices as the nation has stated they intend to increase production by one million barrels per day in 2016. Additionally, in the latest U.S. budget deal, the government lifted the ban on U.S. oil exports meaning that inventories of WTI are likely to start to drop in the year ahead. This has provided some strength to WTI crude relative to Brent. On February 9th the EIA stated in their short term outlook that Brent crude oil prices are forecast to average $38/b in 2016 and $50/b in 2017. West Texas Intermediate (WTI) crude oil prices are expected to average the same as Brent in both years. U.S. crude oil production averaged an estimated 9.4 million b/d in 2015, and it is forecast to average 8.7 million b/d in 2016 and 8.5 million b/d in 2017. EIA estimates that crude oil production in January was 70,000 b/d below the December level, which was 9.2 million b/d.
On February 10th Gary Bourgeault wrote: As global oil supply declined slightly in January by about 200,000 barrels per day to 96.5 million barrels per day, it had no impact on the price because the market was looking at the reintroduction of Iranian oil after sanctions were lifted. Iran reports it has already added about 300,000 barrels to the market, and it has the short-term goal of increasing exports by 500,000 barrels per day. Further out it wants to double that number. Before the sanctions it was supplying the global market with about 3 million barrels per day; dropping to 1 million barrels per day at the time the sanctions were lifted. Saudi Arabia has been consistent on its assertion the oil market will rebalance in 2016, which will support the price of oil. Eventually there will be a rebalancing of the market, as increased demand will finally overcome oversupply. The question is, when will that happen? “I’m very bearish on that happening in the near term, by which I mean in the next couple of years.” There are too many elements now working against it to change direction during that period of time. By the time demand finally catches up with supply, it will support the price of oil, but the problem quickly becomes what happens when other producers bring more supply to the market at that time. That’s especially true with shale producers, because they can prepare the wells and wait to bring more supply to market in a very short time. To offset that, demand will have to be a lot higher than it is today. Since most oil companies have already cut back on development, there could be a period of time when that results in an inability to meet global demand, which would move prices up significantly. That is probably going to take at least five years before we see it happen. There is also the remaining shale-producing countries that are in the early stages of exploration and development. That will become a major contributor to supply over the next decade, which at this time is an unknown as to how it will affect the global market. Even in a low-price oil market, the slowing global economy won’t be enough to rebalance the market in the near term, underscoring how much of an oil glut there is.
WTI is down from a recent high of $59.53 on June 15th 2015. The current price of WTI is the lowest since February 2003. February 2009 at $36.00 was the low point of the recessionary commodity bust.
The price of natural gas, delivered the Henry Hub in Louisiana closed at $2.11 on February 5th, down from $2.20 on January 22nd. February 5th was the latest data published by the EIA. The price has been trending down for two years. The United States is awash in natural gas in spite of the fact that U.S. power stations are now generating more power from natural gas than from coal. The reserves in the Marcellus and Utica shale regions amount to quadrillions of cubic feet of the commodity. The bottom line is that supply is far above demand and is driving the price direction on the New York Mercantile Exchange. The prospect for a substantial rally any time soon is bleak. In the EIA short range forecast of February 9th they stated that natural gas working inventories were 2,934 billion cubic feet (Bcf) on January 29, 20 percent higher than during the same week last year and 18 percent higher than the previous five-year average (2011-15) for that week. EIA forecasts that inventories will end the winter heating season (March 31) at 2,096 Bcf, which would be 41 percent above the level at the same time last year. Henry Hub spot prices are forecast to average $2.64/million British thermal units (MMBtu) in 2016 and $3.22/MMBtu in 2017, compared with an average of $2.63/MMBtu in 2015.
Figure 2 shows the apparent supply of the two main steel tubular products used in oil and gas production from February 2003 through December 2015 (Apparent supply is a proxy for demand).
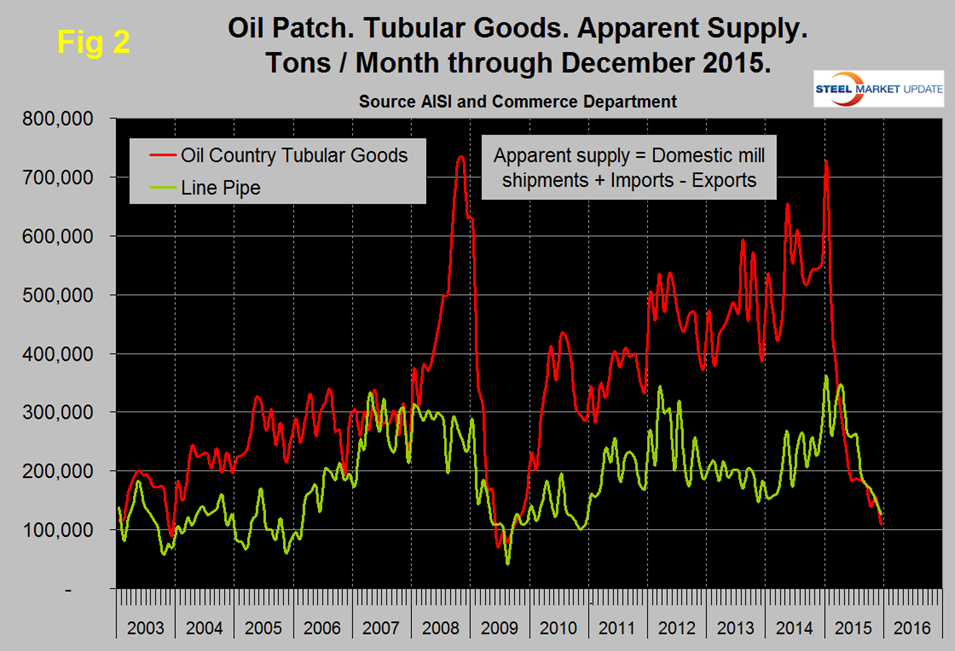
The demand for OCTG is now the lowest since November 2009, demand averaged about 600,000 tons per month from May 2014 through January last year but in three months through December 2015 had declined to an average of 135,000 tpm. Since January last year, line pipe demand has declined to a level not seen since Q1 2014. Imports of pipe and tube were down by 62.1 percent year/year in three months through January, which was more than any other product.
The total number of operating rigs in the US and Canada on February 12th was 763, down from 850 in one month and down from 2,018 on February 2nd 2015. Year over year the total US and Canada rig count is down by 56.1 percent. Figure 3 shows the Baker Hughes US Rotary Rig Counts for oil and gas equipment in the US through February 12th (explanation below).
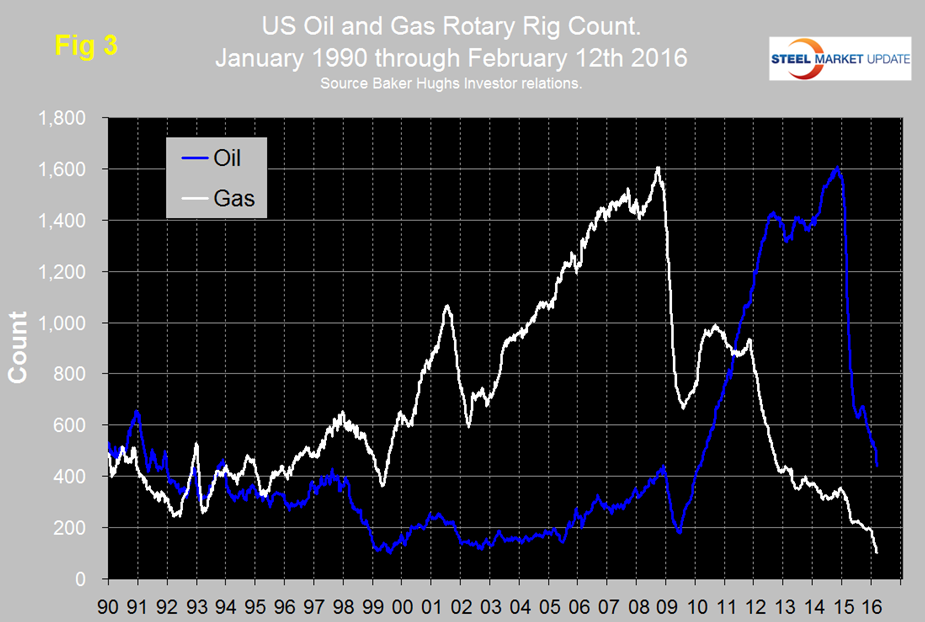
The decline in the US oil rig count hesitated in July and August but since then has been continuous and was down by 56 in the last month. The decline in the oil rig count didn’t begin until October 10th last year, four months after the beginning of the oil price collapse. After a slight recovery in late 2011 the decline in the gas rig count has continued with an acceleration in the most recent data.
On a regional basis in the US, the big three states for operating rigs are Texas, Oklahoma and North Dakota. Texas at 245 on February 12th was down from 305 on January 8th, Oklahoma at 76 was down from 83 and North Dakota at 39 was down from 49.
SMU’s view is that based on all we read, low oil prices (<$50) will be with us through 2017 and neither the price nor the oil and gas rig counts have bottomed yet. Inventory adjustments must be playing a part in the demand decline of OCTGs. We have no information detailing the proportion of oil field tubulars that are handled by service centers but assume it is small and there have been recent reports in the press that one major producer plans to intensify their go direct policy.
Baker Hughes Rotary Rig Count: These are a weekly census of the number of drilling rigs actively exploring for or developing oil or natural gas in the United States. Rigs are considered active from the time they break ground until the time they reach their target depth and may be establishing a new well or sidetracking an existing one. The Baker Hughes Rotary Rig count includes only those rigs that are significant consumers of oilfield services and supplies.


