Market Data

February 19, 2016
Service Center Apparent Excess Results & Forecast
Written by John Packard
As part of your Premium level service, Steel Market Update (SMU) analyzes the service center shipment and inventory data and provides a short term forecast for carbon flat rolled steel shipments, inventories and how they will impact pricing over the next four months. This is done through a proprietary model and the results provided are called the Service Center Apparent Excess/Deficit forecast.
The Metal Service Center Institute (MSCI) released flat rolled shipment and inventories data earlier this week. Steel Market Update then takes that data and compares it against our forecast to see if shipments and inventories fell within the ranges we had suggested to our Premium level members one month ago.
Our January shipment forecast was for 2,077,000 tons for the month. Actual shipments according to MSCI came in at 2,075,000 tons (Bingo!).
Where we missed our mark was where flat rolled inventory levels would be at the end of January. We had forecast receipts would be 5 percent lower than the 3 year average thus ending the month with 5,515,000 tons of flat rolled inventories on the distributors’ floors.
The actual inventories came in at 5,241,000 tons. This is 274,000 tons lower than our forecast.
The lower flat rolled inventory levels affects our Apparent Inventory Excess forecast. We had forecast a reduction in our Apparent Excess from 1,031,000 tons at the end of December to 974,000 tons (forecast) at the end of January. We got the direction correct but missed the final number. Instead of Apparent Excess at 974,000 it dropped to 705,000 tons.
What this means is our model has to take into consideration the change in the bigger picture and its impact on when we believe service centers flat rolled inventories will be “in balance” based on our model.
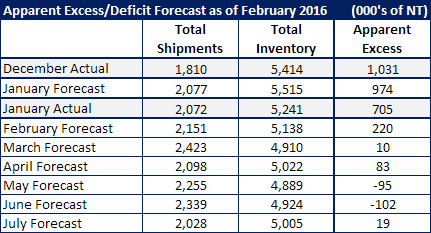
So, here is what we believe will happen in February based on the latest numbers and how we see the market flowing from here:
February shipments are anticipated to be 5 percent lower than February 2015. This would give us a total shipment figure of 2,151,000 which is slightly better than the 2,072,000 reported for January 2016.
February inventories are forecast to drop to 5,138,000 which would take our Apparent Inventory Excess down to 220,000 tons. Our forecast is calling for daily receipts to be 10 percent lower than the 3 year average for flat rolled products (January was 17.3 percent lower).
Over the longer term we have flat rolled inventories back to a “balanced” position in March and then actually going into a Deficit position by May.
We believe service centers are already responding to the lower inventories. This was seen in some of the buying done since the middle of December which has resulted in longer lead times on cold rolled and coated products especially.
Our shipment forecast calls for lower YOY shipments for February and March but then we see shipments stabilizing in our model (but my gut tells me they will actually improve YOY by the time we get to May). So, we decided to show you two models this afternoon. The first table will be our first forecast which is our conservative view on the market (see below).
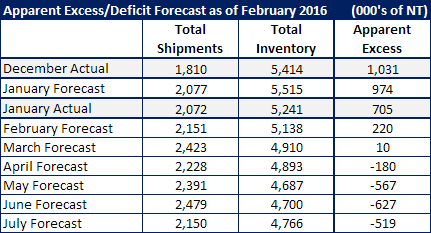
The second forecast is taking a more optimistic view of the market and building in more demand thus squeezing inventories and then increasing receipts as we get into May, June and July. This is what that forecast looks like:
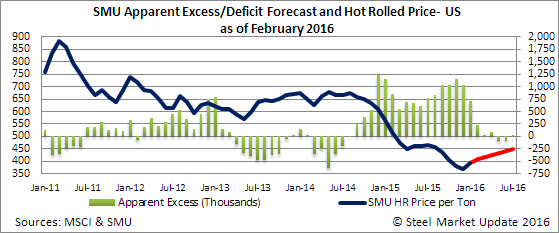
The last graphic we are sharing today is we anticipate a slow modest rise to flat rolled steel prices during the next few months. SMU hot rolled is $405 per ton this week. We are forecasting that it could go as high as $450 per ton over the next six months. The strength will continue to be in cold rolled and coated products so we anticipate a $130-$160 spread against hot rolled versus the more traditional $100-$120 per ton spread. The forecast used in the model below is our conservative forecast which does not show large deficits but a more balanced inventory situation.