

Analysis

February 21, 2016
Housing Data Points to Slow Growth
Written by Peter Wright
The article below is normally published to our Premium members as a supplement to the Executive write up. The author is Peter Wright who produces a number of articles for both our Premium and Executive level newsletters. Peter is also one of our Steel 101 instructors where he shares both his marketing and metallurgical knowledge with those attending our workshop.
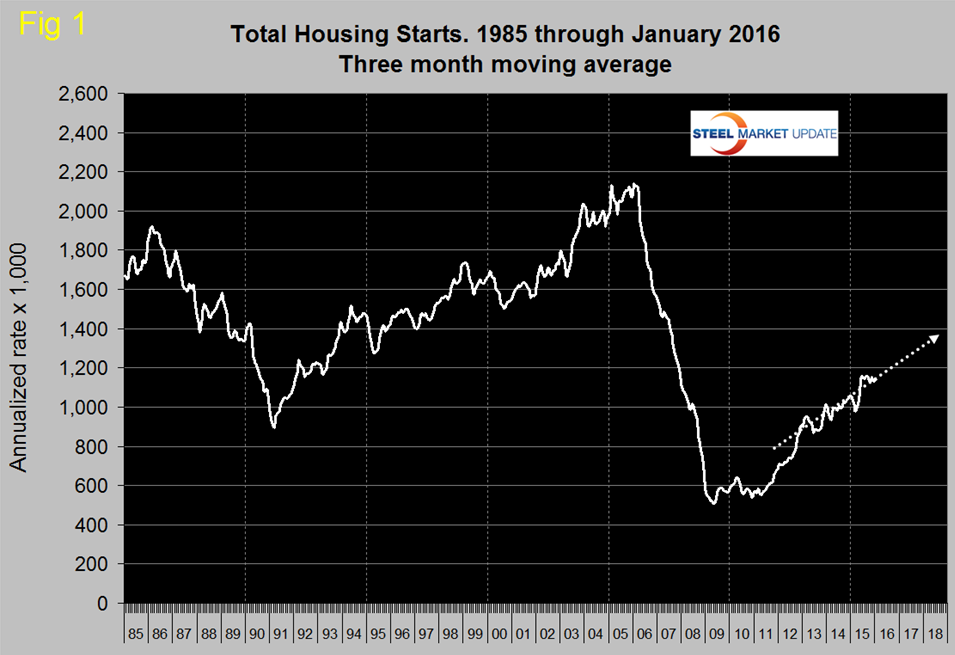
Total housing starts in January were at an annual rate of 1,099,000 which was down from 1,143,000 in December. Since April 2015, total monthly starts annualized have ranged from 1,062,000 to 1,211,000 with the high month being June. In January the three month moving average (3MMA) was 1,139,000 which was up from 1,130,000 in December. The 3MMA has been really tight since last June ranging between 1,130,000 and 1,160,000. August 2015 at 1,160,000 had the highest 3MMA since the recession. Total starts are still on track to reach 1.4 million units annualized by the end of 2018 (Figure 1).
Single family starts in January were at an annual rate of 731,000 with a 3MMA of 759,000. The 3MMA was up by 8.5 percent year over year but is still 59.9 percent below the peak of late 2005. Multifamily (apartments/condominiums) starts in January were at an annual rate of 368,000 with a 3MMA of 380,000, up 6.8 percent y/y (Figure 2).
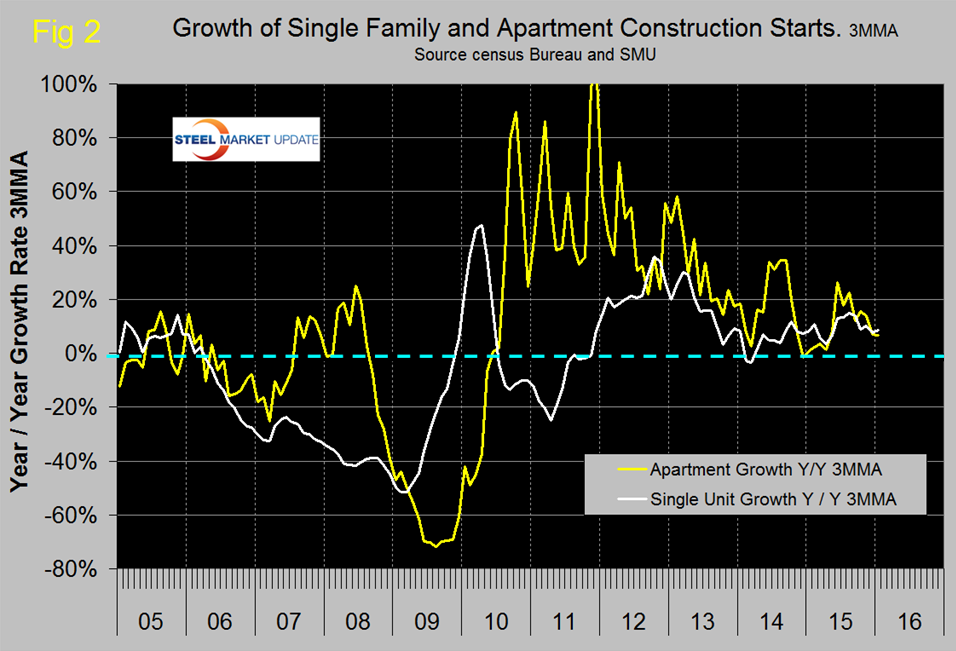
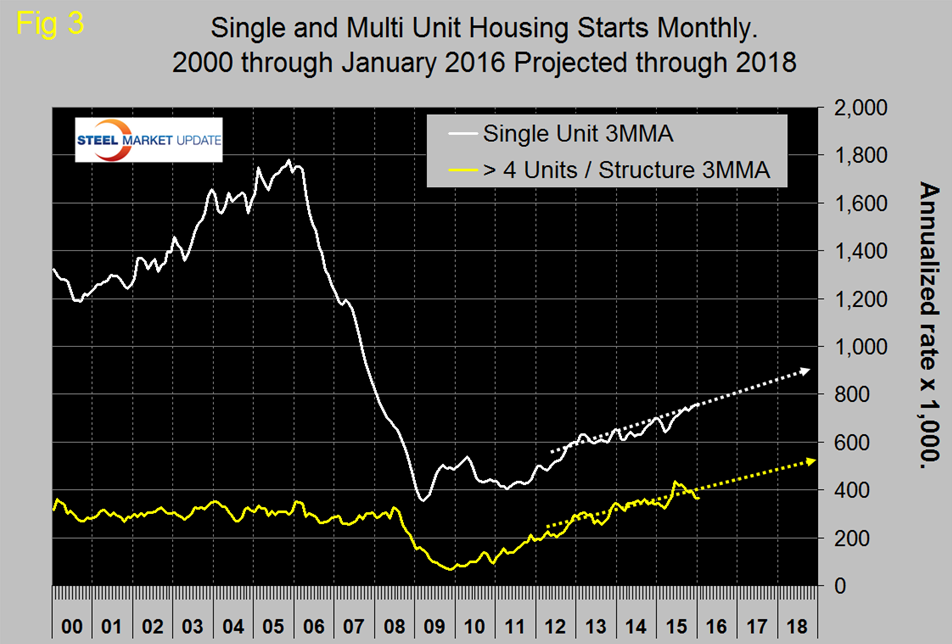
The Census Department results are seasonally adjusted and the monthly numbers are annualized. Multifamily starts had lack-luster growth for seven months prior to June and after a three month surge are now back to what is may be a more sustainable level. There are also regional drivers in the multifamily market as discussed below. The trajectory of single family and apartments >4 units are tracking to reach 900,000 and 500,000 by the end of 2018, respectively (Figure 3).
The Associated General Contractors of America wrote on February 16th: “In the fourth quarter of 2015, a seasonally adjusted 63.7 percent of households were homeowners, down from 63.9 percent a year earlier and the lowest fourth-quarter homeownership rate since 1989, according to data the U.S. Census Bureau posted on January 28. The fourth-quarter rate has declined for 11 consecutive years. In the same release, Census reported that the vacancy rate for rental housing, not seasonally adjusted, in the fourth quarter was 7.0 percent, the same as a year earlier and the lowest fourth-quarter vacancy rate since 1993. Together, these series suggest continuing strong demand and tight supply for rental housing, conditions supportive of further multifamily construction.”
Permit data is considered to be a leading indicator for starts. If permits exceed starts then there should be an acceleration in construction and vice versa. Total permits in January were at an annual rate of 1,202,000 with a 3MMA of 1,229,000. Permits have been well ahead of starts for the last three months (Figure 4), however it looks as though permits don’t always lead to ground breaking and sometimes, as in 2013, there can be quite a wide divergence.
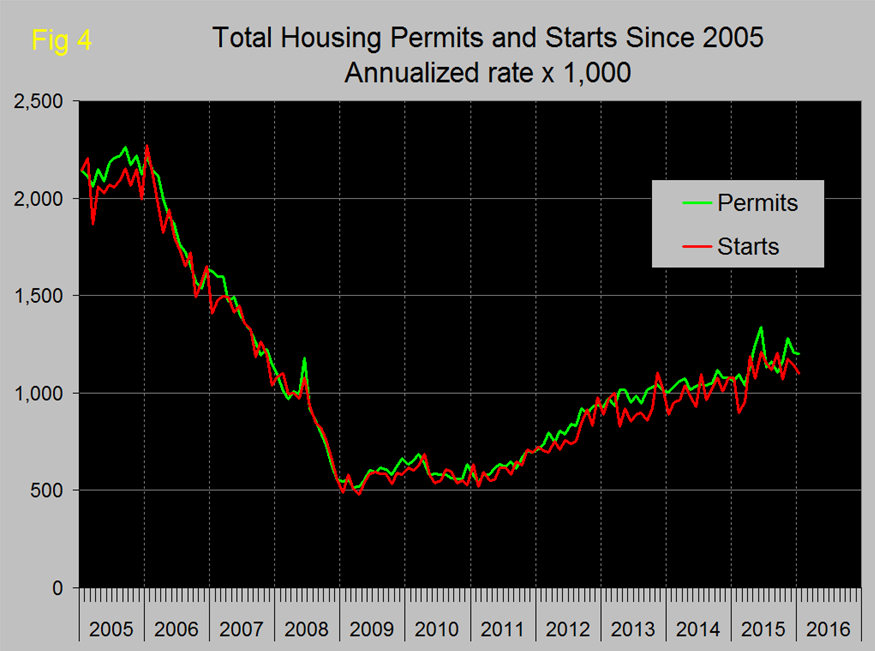
It also looks from Figure 4 that permits don’t really lead starts suggesting that the two are very close together from a timing point of view. On a 3MMA basis total permits were up by 14.7 percent y/y. Single family were up by 8.7 percent and multifamily by 24.7 percent. Multifamily permit growth peaked at 41.4 percent y/y in July last year as buyers moved to take advantage of a tax subsidy in New York State that ended in the 3rd quarter.
Table 1 shows total permits and starts nationally and regionally.
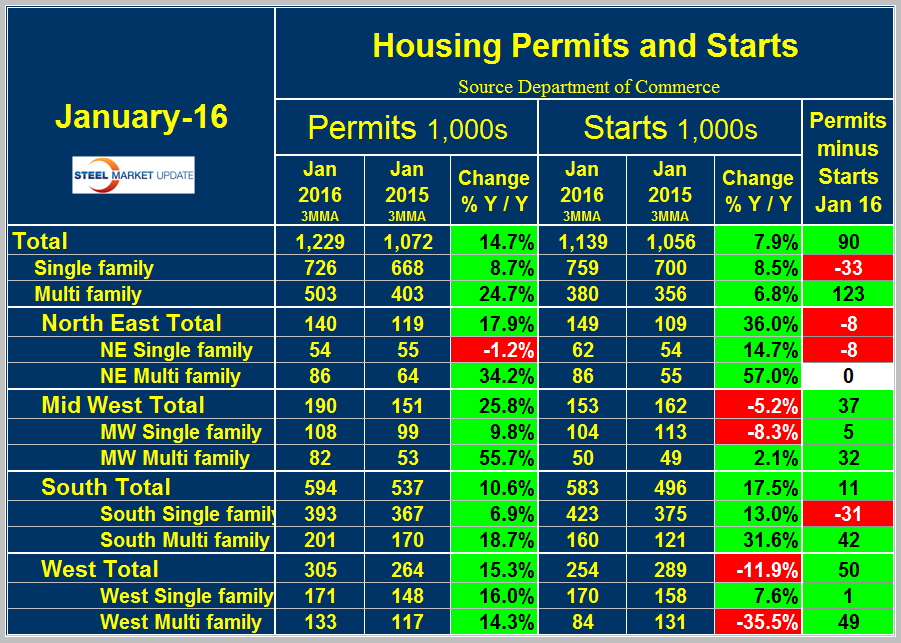
At the national level the differential between permits and starts for single and multi-family units is suggesting that the shift in consumer’s preference towards apartments is ongoing. Permits for multifamily have well exceeded those for single family in eight of the last nine months which should have led to a difference in starts growth rates by now but as shown in Figure 2 this is not the case. In January on a 3MMA basis, permits of multi-family exceeded starts by 123,000 in contrast to the negative 33,000 for single family. In total permits were 90,000 more than starts. In the recent past the differential between permits and starts for multi and single family units has been the same across all regions but this is no longer the case. In all regions except the NE, total permits exceeded total starts and in that region single family permits were 8,000 less than starts and multifamily permits were the same as starts. In the West, multifamily starts fell by 35.5 percent year over year but were up in all other regions. The implication is that except in the West the shift in preference for apartments is by no means over and that single family construction will slow slightly. The ratio of the two sectors is shown in Figure 5 and demonstrates that single family homes continue to be less desirable than at any time since 1985.
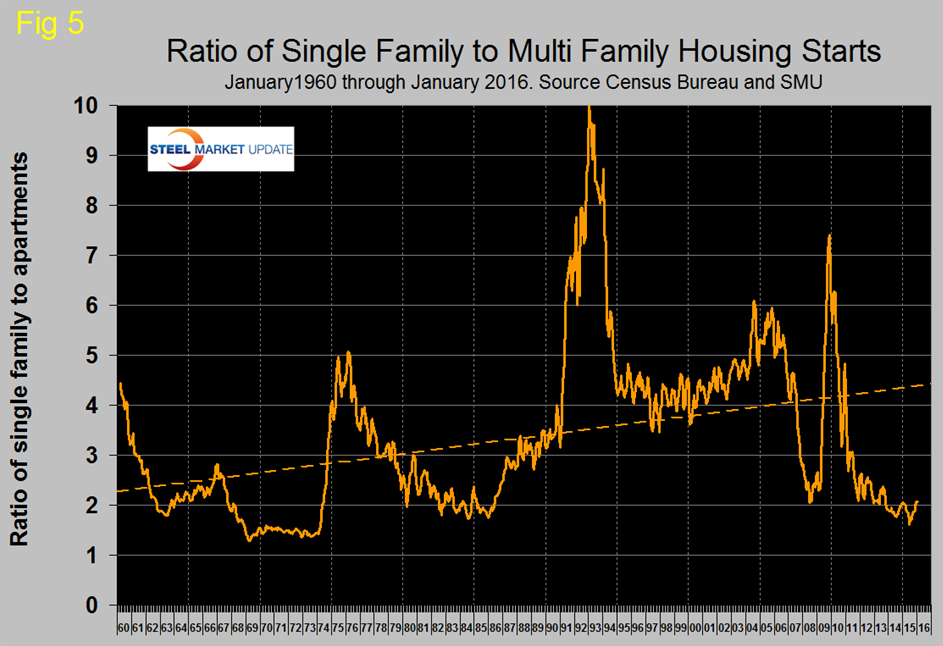
Figure 6 shows the regional situation for the 3MMA of total residential starts since February 2000.
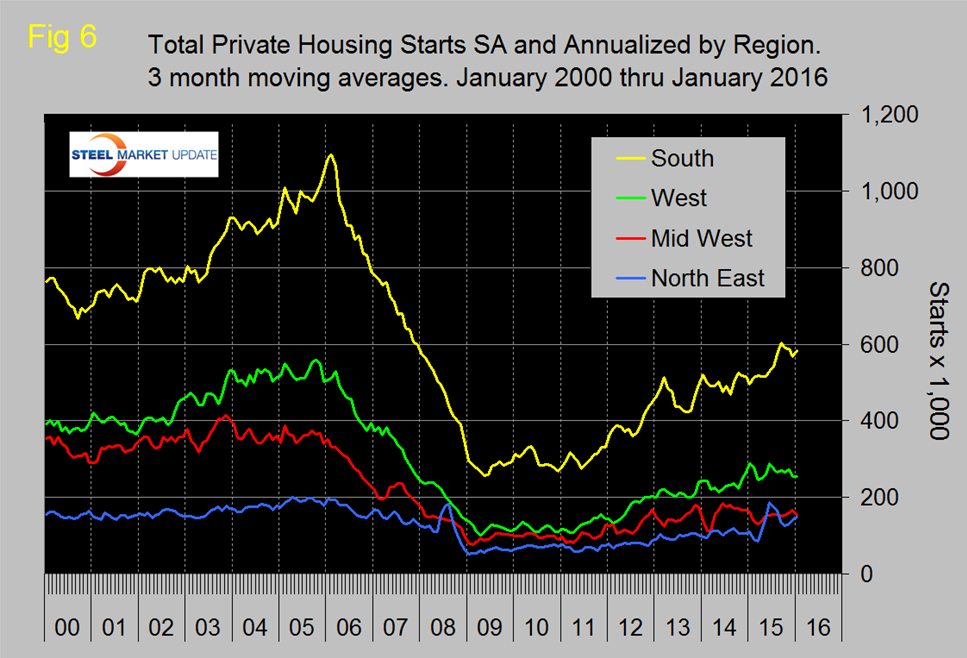
In the first half of 2015 the North East had the highest growth rate driven as mentioned above by apartment construction in New York state but now that has cooled. The South had the most consistent growth in 2015.
On January 29th, Armada Executive Intelligence had this to say about the importance of the housing market to the general economy: Why is the status of the housing market so important to the economy as a whole? There are basically three reasons and they all tend to reinforce one another. The first is that home building drives a lot of industry sectors – everything from textiles to appliances, lumber, concrete and so on. These industries live and die by the demand for new homes and especially the multi-family units. The second major impact is on employment. The construction business remains one of the few labor intensive sectors in the economy as there are far too many tasks that really can’t be done with a robot or an app. Somebody needs to pour that foundation, hang the drywall and wire the place. The recession of 2008 was devastating as far as job losses were concerned and many of these were lost from construction. Finally, there is the role that housing plays in the financial system and that may be the most significant of them all. The banking system depends on the mortgage – especially the smaller banks. Then there is the whole industry that revolves around the sector – real estate agents, title companies, inspectors, insurance and so on. This is a sector that creates dozens of industries and sub-industries. The bottom line is that what happens in housing is really far more important than what is happening in the oil sector right now. The economy really does look a lot healthier than it would seem.
The National Association of Home Builders (NAHB) confidence report was released on Tuesday. Any value above 50 indicates an overall positive business confidence. The national average rose one point in January and dropped three points in February. It is now seven points lower than October which had the highest confidence level since our data stream began in January 2009. On a 3MMA basis, the index fell from 61.0 in January to 59.7 in February (Figure 7).
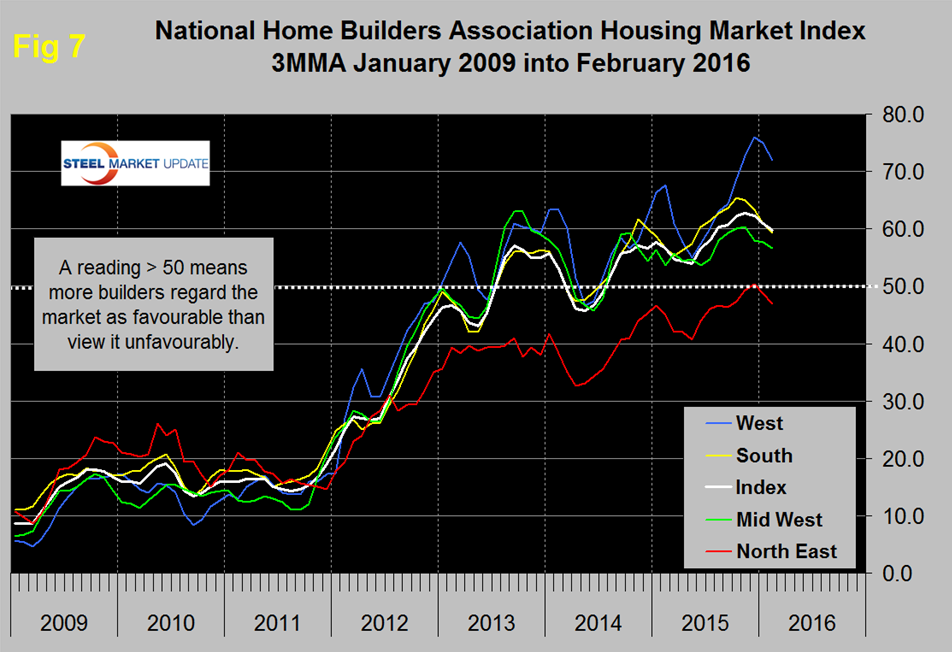
These are still good results for all except the North East but all regions are showing a downtrend. The official news release from NAHB reads as follows:
Builder Confidence Drops Three Points in February
Builder confidence in the market for newly-built single-family homes fell three points to 58 in February from an upwardly revised January reading of 61 on the National Association of Home Builders/Wells Fargo Housing Market Index (HMI).
“Though builders report the dip in confidence this month is partly attributable to the high cost and lack of availability of lots and labor, they are still positive about the housing market,” said NAHB Chairman Ed Brady, a home builder and developer from Bloomington, Ill. “Of note, they expressed optimism that sales will pick up in the coming months.”
“Builders are reflecting consumers’ concerns about recent negative economic trends,” said NAHB Chief Economist David Crowe. “However, the fundamentals are in place for continued growth of the housing market. Historically low mortgage rates, steady job gains, improved household formations and significant pent up demand all point to a gradual upward trend for housing in the year ahead.”
Derived from a monthly survey that NAHB has been conducting for 30 years, the NAHB/Wells Fargo Housing Market Index gauges builder perceptions of current single-family home sales and sales expectations for the next six months as “good,” “fair” or “poor.” The survey also asks builders to rate traffic of prospective buyers as “high to very high,” “average” or “low to very low.” Scores for each component are then used to calculate a seasonally adjusted index where any number over 50 indicates that more builders view conditions as good than poor.
The HMI component measuring sales expectations in the next six months rose one point to 65 in February. The index measuring current sales condition fell three points to 65 and the component charting buyer traffic dropped five points to 39.
Looking at the three-month moving averages for regional HMI scores, all four regions registered slight declines. The Midwest fell one point to 57, the West registered a three-point drop to 72 and the Northeast and South each posted a two-point decline to 47 and 59, respectively.
Editor’s Note: The NAHB/Wells Fargo Housing Market Index is strictly the product of NAHB Economics, and is not se en or influenced by any outside party prior to being released to the public. HMI tables can be found at nahb.org/hmi. More information on housing statistics is also available at HousingEconomics.com.
SMU Comment: It seems to us that the overall housing market is experiencing a slow and consistent growth but the days when owning a single family home was a beacon for new families is over. Renting is clearly attractive to more people than it used to be and we are not sure how or when that will change. Factors that seem to be significant are student loan debt which is now around $1.3 trillion dollars, the rise in single person and single parent families and the realization that an increase in home prices is not inevitable.


