

Market Data

February 23, 2016
Currency Update for Steel Trading Nations
Written by Peter Wright
Currency markets have been anything but stable since our last update on January 25th and this shows up clearly in our examination of the currencies of the steel trading nations. Expectations of four rate hikes by the FOMC seem to have flown out the window. On February 3rd Josh Brown wrote, “Perhaps the biggest headline of the day was with the US dollar, which got hit with its worst one-day loss in seven years. There was no clear catalyst for the massive loss. I haven’t even seen many plausible theories. If I had to guess, the dollar dropped because many people were betting on the dollar going higher with all the promised rate hikes. And now that there won’t be any more hikes, everyone suddenly realized they should unwind their dollar longs, and as soon as momentum turned negative, it developed into a feeding frenzy. Again, though, I can only speculate. Massive moves like that are usually driven by some huge economic event or unexpected Central Bank action. A 7-year biggest decline totally out the blue? Let’s just say the markets are on edge.”
![]()
On February 10th the Wall Street breakfast had this to say: Fresh tremors are hitting global markets as a cautious tone from the Federal Reserve and another fall in crude prices fuel anxiety about the world economy. “Financial conditions in the United States have recently become less supportive of growth,” Fed Chair Janet Yellen said on Feb 9th, highlighting risks that could delay the central bank’s plans for raising rates. So what’s happening out there? Investors are piling into safe havens such as gold and government bonds, while dumping U.S. dollars and selling equities.
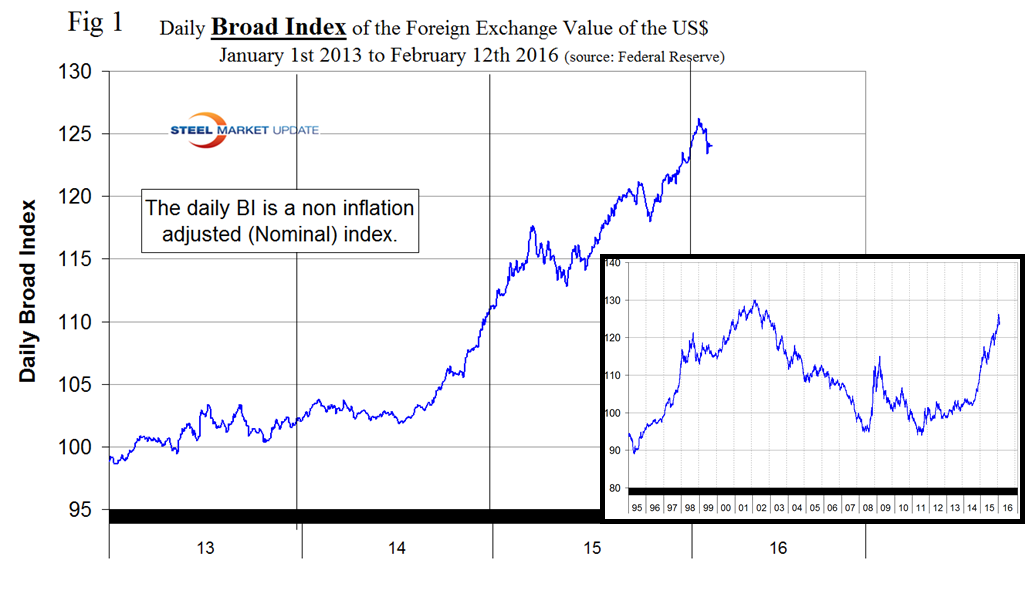
The latest data for the Broad Index value of the US $ against the currencies of our major trading partners was February 12th, which was nine days behind the individual steel trading currency data that we are presenting here. On February 12th the daily BI at 124.11, down by 1.2 percent in the previous 30 days. Figure 1 shows the daily BI since January 1st 2013 with an insert to show how this latest period fits into the longer term picture since January 1995.
Mohamed El Erian in his latest book ‘The Only Game in Town’ published a few weeks ago summed up the currency markets rather nicely when he wrote, “by depreciating their currencies, countries seek to capture market share from others by making their exports cheaper and their imports more expensive. Indeed with the notable exception of the US and (until August 2015) China, that is the course that the majority of the world’s economies, big and small have embarked on recently. And until now, because it is a relatively closed economy where trade accounts for a rather small share of GDP, the US has been the only major economy willing to see its currency appreciate significantly, and able to afford a transfer of growth impetus to other countries. But even here there is a limit, especially as companies find it harder to compete.
Table 1 shows the change in currencies of 16 steel and iron ore trading nations in one year, three months, one month and seven days for each currency and is color coded to indicate strengthening of the dollar in red and weakening in green.
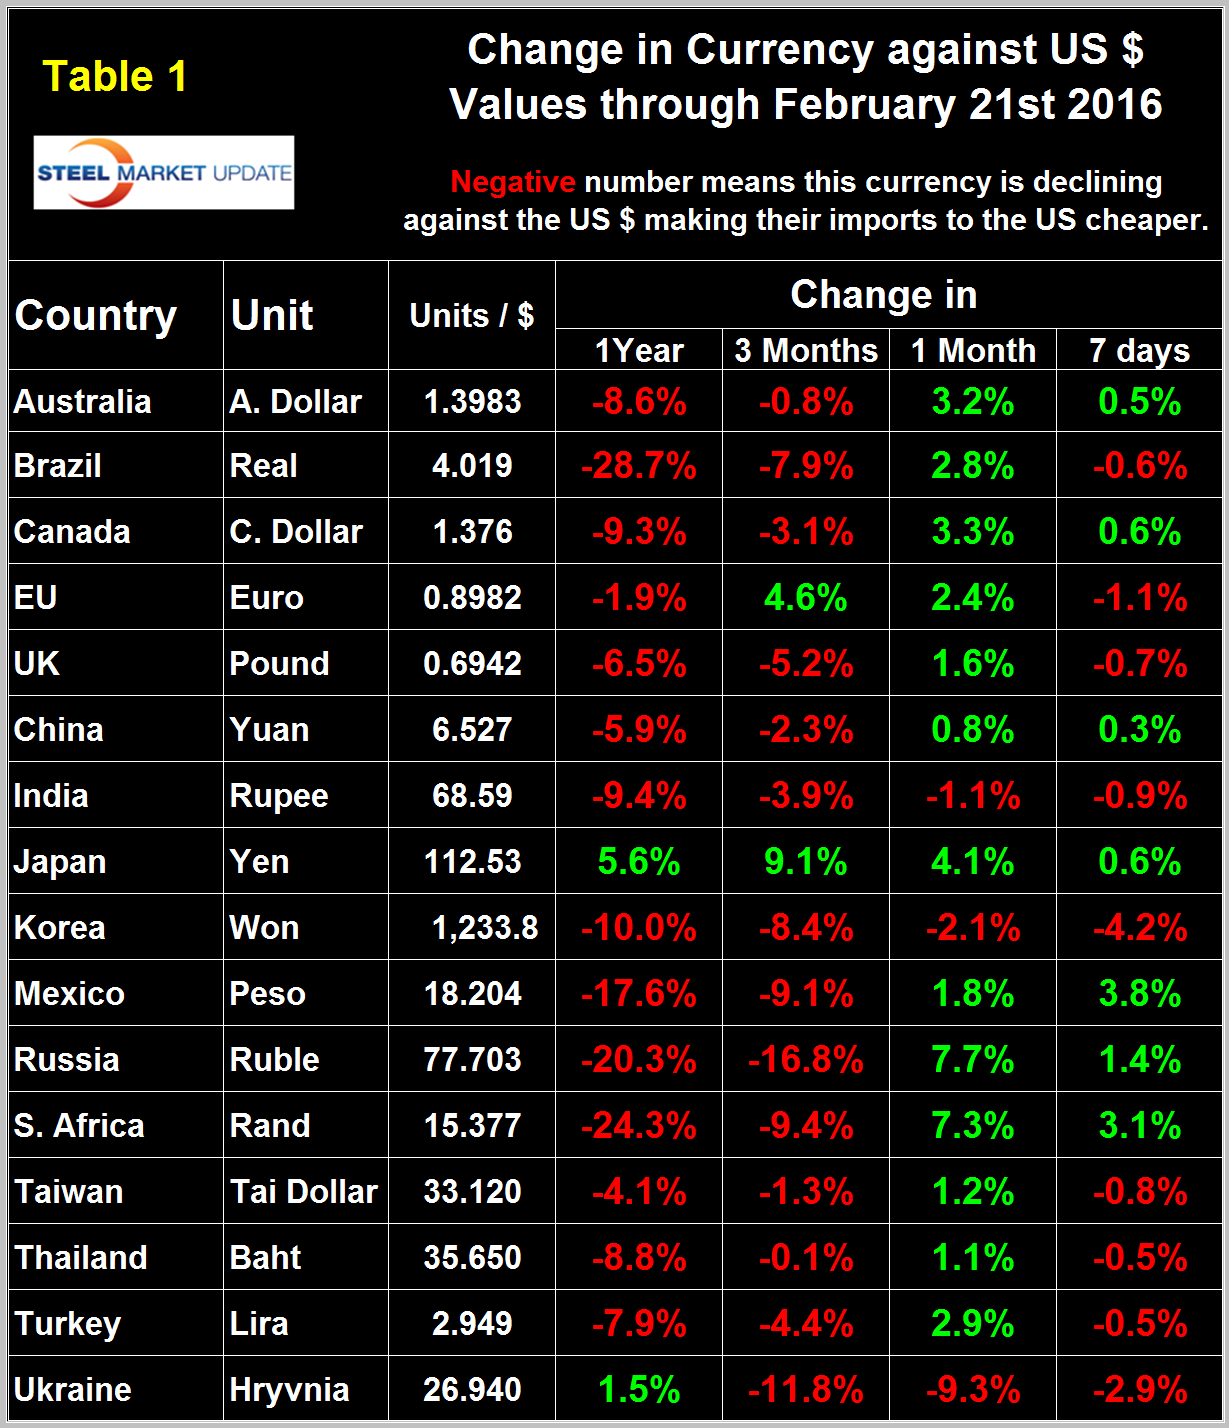
We regard strengthening of the US Dollar as negative and weakening as positive because the effect on net imports. In 2014, 25 percent of the U.S. economy had some involvement in international trade therefore currency swings can have a large effects on the economy in general and of the steel industry in particular. In the 30 days before our January 25th update the dollar strengthened against 14 of the 16 currencies under consideration as traders increased their dollar positions to obtain a better return on their assets. In the 30 days before this update of February 21st the dollar did a complete reversal and weakened against 13 of the 16 steel and raw materials trading currencies. We saw a harbinger of this move at the 7 day level in our January 25th report. We assume that currency traders over bought the dollar and then decided to reduce their positions. Looking at the 7 day level in this data the dollar is swinging back the other way to some extent with a strengthening against 9 of the 16 steel trading currencies. However it looks from Figure 1 as though this recent weakening is a fairly significant move in a historical context.
In each of these reports we comment on a few of the 16 steel trading currencies listed in Table 1 and include extracts from sources that we have come across that we deem credible. Charts for each of the 16 currencies listed in Table 1 are available through February 21st for any reader who requests them.
The Euro
On February 21st it took 1.133 US dollars to buy one Euro (Figure 2).
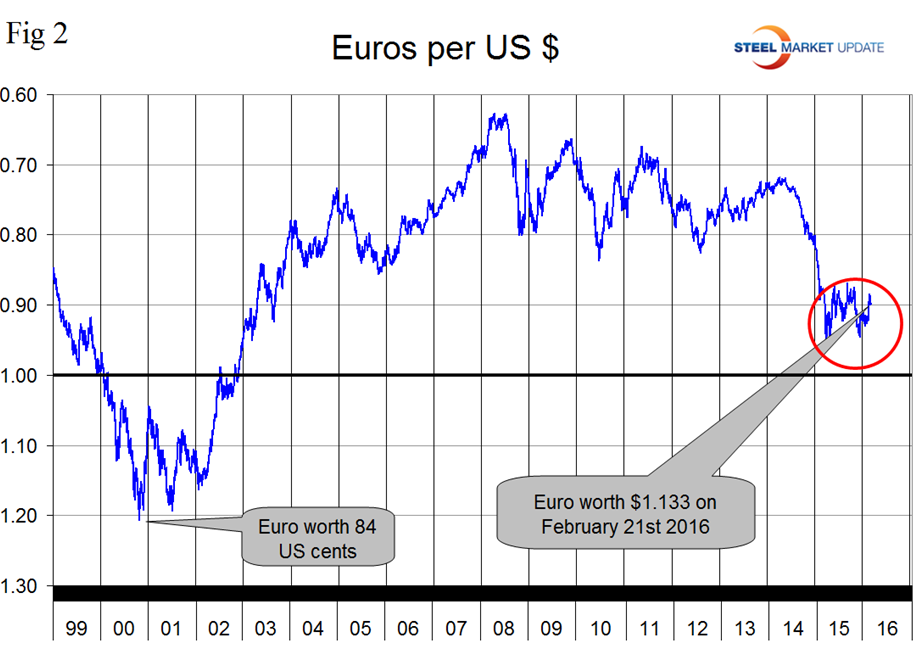
Through that date the Euro had strengthened by 4.6 percent in three months and by 2.4 percent in the last month. The Euro had a recent low of 1.0580 on November 30th. The euro has been trading in a range for almost a year now as traders compare the monetary policy activities of the Fed and the ECB.
The Japanese Yen
Wall Street breakfast, January 29: The Bank of Japan shocked financial markets overnight by adopting negative interest rates for the first time ever, in a desperate attempt to kick start the world’s number three economy. A rate of -0.1 percent will now apply to excess reserves parked at the central bank, which will extend the policy “as long as it is necessary.” The decision saw global shares jump, the yen fall and sovereign bonds rally, and comes a day after the surprise resignation of Economy Minister Akira Amarui.
On February 17th Ivan Martchev wrote. When the BOJ moved toward negative short-term interest rates at the end of January, I opined that a strengthening of the yen was possible even though the BOJ was targeting a weaker yen. However, I am rather surprised to see how fast the currency markets humbled the BOJ by delivering a monstrous move in the opposite direction than the BOJ was targeting. To compare the magnitude of the yen move, it is bigger than the August 2015 swoon in the yen that was driven by the Chinese token devaluation. It is also just a bit smaller but comparable in magnitude to the September 2008 yen move when Lehman Brothers failed.
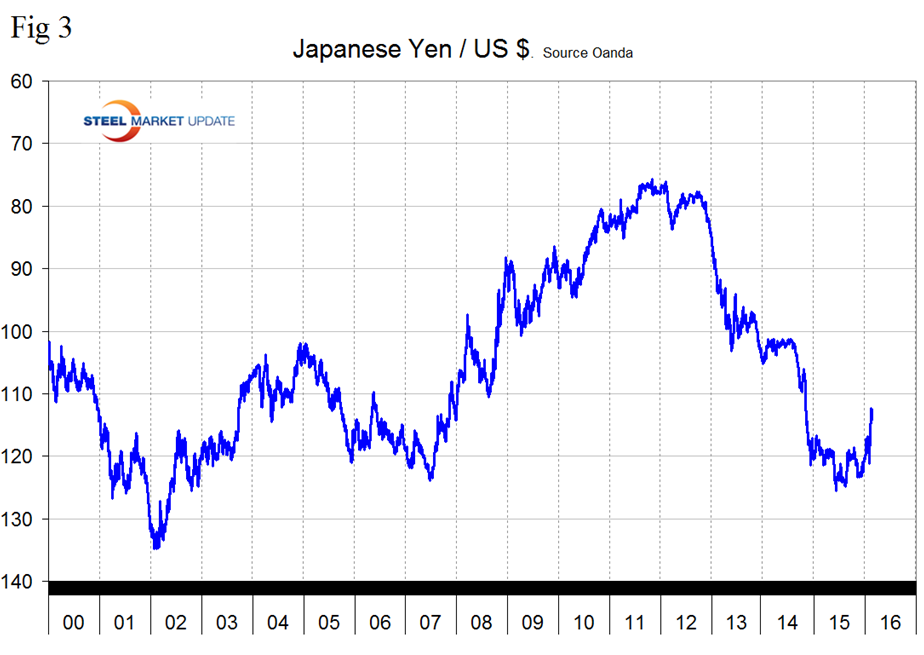
Figure 3 shows the value of the Yen since January 2000. The Yen has strengthened by 9.1 percent in 3 months and 4.1 percent in the last month to close at 112.5/US $ on February 21st.
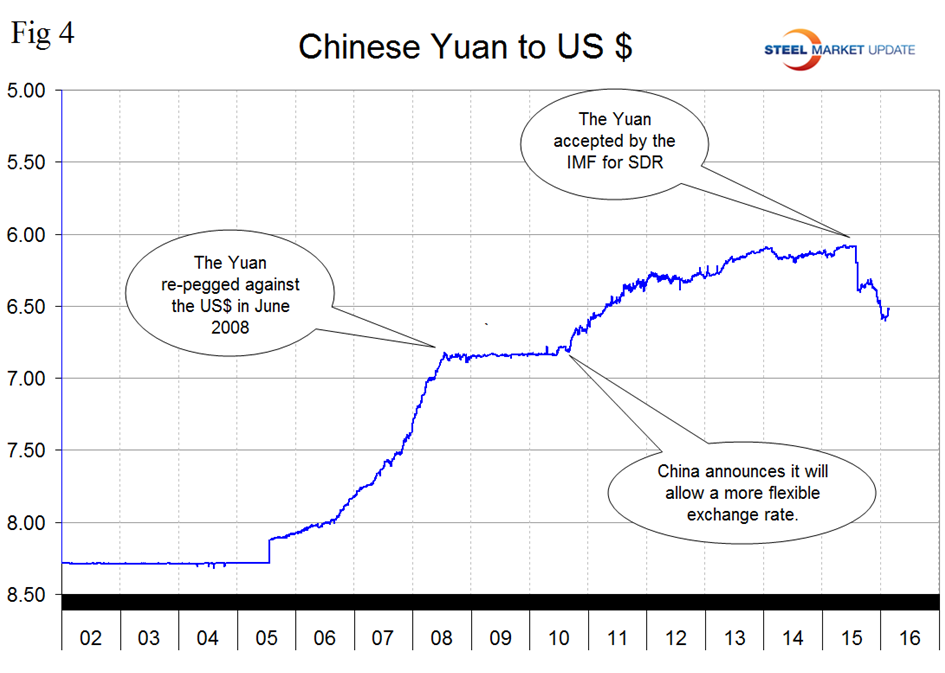
The Chinese Yuan
On February 17th John Mason wrote; during the past weekend, just after the Chinese holidays ended, Zhou Xiaochunan, governor of the People’s Bank of China, spoke out about the value of the renminbi. He indicated that he was not overly concerned about the capital outflows that China had been experiencing and stated that there were no plans to further weaken the renminbi. Even though China’s growth and Chinese trade has been weaker than expected, Mr. Xiaochunan stated that “There’s no motive to depreciate the renminbi for the sake of net export expansion.” On Monday, the renminbi jumped 1.2 percent, the largest one-day increase in the value of the currency since July 2005. I still believe that China wants a strong currency, wants a rapidly growing economy, and wants to be a major player in the global economy. I believe that Chinese officials have been having a lot of discussions since last August when they announced a surprise devaluation of the renminbi. This move caused a substantial amount of volatility in world markets and was talked about in one way or another for most of the fall and into the winter. This move also came around the time that the International Monetary Fund approved the inclusion of the Chinese renminbi in the list of reserve currencies around the world that included the US dollar, the British Pound, the Japanese Yen, and the Euro. Recently, there has been major concern about the loss of foreign exchange reserves as a result of the slowdown in Chinese economic growth and the consequent outflow of capital. This outflow has been pretty substantial at times. Many observers have suggested that China will have to impose controls on the outflow of capital from the country.
Following the devaluation in August the Yuan bottomed out at 6.4028 on August 27th. Then it recovered to 6.3185 on October 31st bottomed out again on January 9th at 6.5907 and has since recovered slightly to 6.5269 on the 21st (Figure 4).
Explanation of Data Sources: The broad index is published by the Federal Reserve on both a daily and monthly basis. It is a weighted average of the foreign exchange values of the U.S. dollar against the currencies of a large group of major U.S. trading partners. The index weights, which change over time, are derived from U.S. export shares and from U.S. and foreign import shares. The data are noon buying rates in New York for cable transfers payable in the listed currencies. At SMU we use the historical exchange rates published in the Oanda Forex trading platform to track the currency value of the US $ against that of sixteen steel trading nations. Oanda operates within the guidelines of six major regulatory authorities around the world and provides access to over 70 currency pairs. Approximately $4 trillion US $ are traded every day on foreign exchange markets.


