

Prices

March 11, 2016
Flat, Long, and Semi-Finished Imports through February 2016
Written by Peter Wright
Licensed data for February was reported by the Steel Import Monitoring System of the US Commerce Department on March 8th. At SMU we perform a detailed analysis of this data, an explanation of our methodology is given at the end of this write up. Total rolled product licensed imports in the single month of February were 1,856,999 short tons down by 13.2 percent from the final January volume. We prefer not to dwell on single months results because of the extreme variability that can occur in individual products.
![]() In the comments below we use only three month moving averages (3MMA) to get a more representative picture. The 3MMA through February was 1,982,370 tons, down by 0.3 percent from the 3MMA through January. On the same basis flat rolled was down by 1.4 percent, long products was up by 1.8 percent and pipe and tube up by 1.0 percent.
In the comments below we use only three month moving averages (3MMA) to get a more representative picture. The 3MMA through February was 1,982,370 tons, down by 0.3 percent from the 3MMA through January. On the same basis flat rolled was down by 1.4 percent, long products was up by 1.8 percent and pipe and tube up by 1.0 percent.
Figure 1 shows the 3MMA through February licenses for semi-finished, flat and long products.
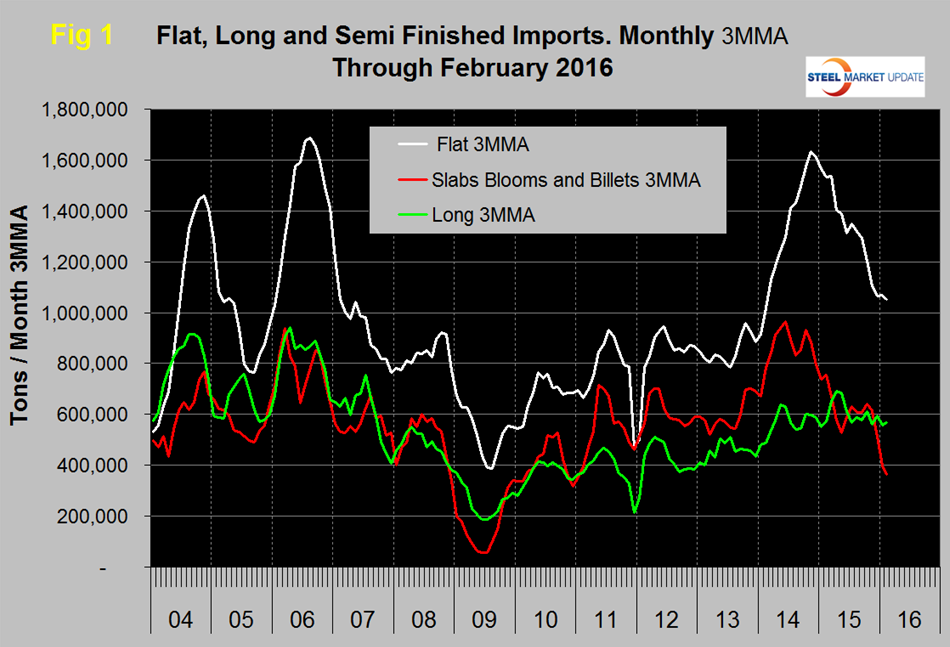
Flat includes all hot and cold rolled sheet and strip plus all coated sheet products including tin-plate plus both discrete and coiled plate. The 3MMA of flat rolled imports peaked at 1,634,000 tons in November 2014 and declined to 1,052,077 tons in February 2016. This was the lowest month since February 2014, two years ago. In November 2014 the 3MMA of semi-finished imports was 884,641 tons, this volume declined to 365,393 tons in February 2016 which was the lowest volume since January 2011. Long product imports have been stuck in the range 519,000 tons to 772,000 tons since March 2014 with no particular trend evident. In February the 3MMA of long product imports was 566,732 tons.
Figure 2 shows the trend of sheet and strip products since February 2011.
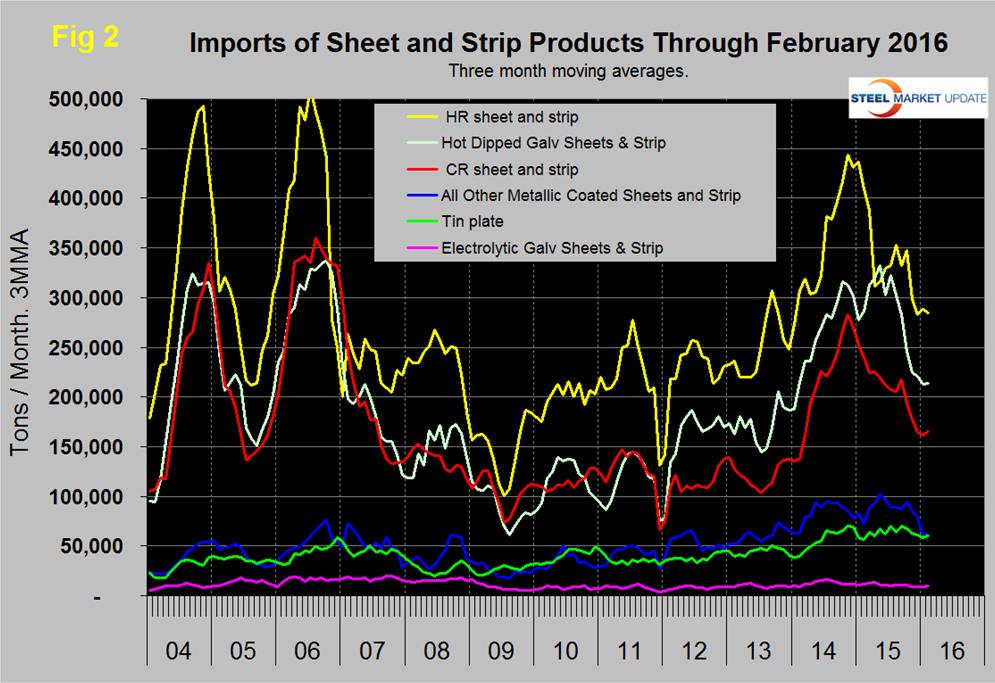
Of the big three tonnage items, HR, CR and HDG, all 3 are down sharply since Q3 last year as is all other metallic coated (mainly Galvalume). Tin plate volume has been little changed in over 18 months and electro-galvanized has been little changed in three years.
Table 1 provides an analysis of major product groups and of sheet products in detail. It compares the average monthly tonnage in the latest three months through February with both three months through November (3M/3M) and three months through February 2015 (Y/Y).
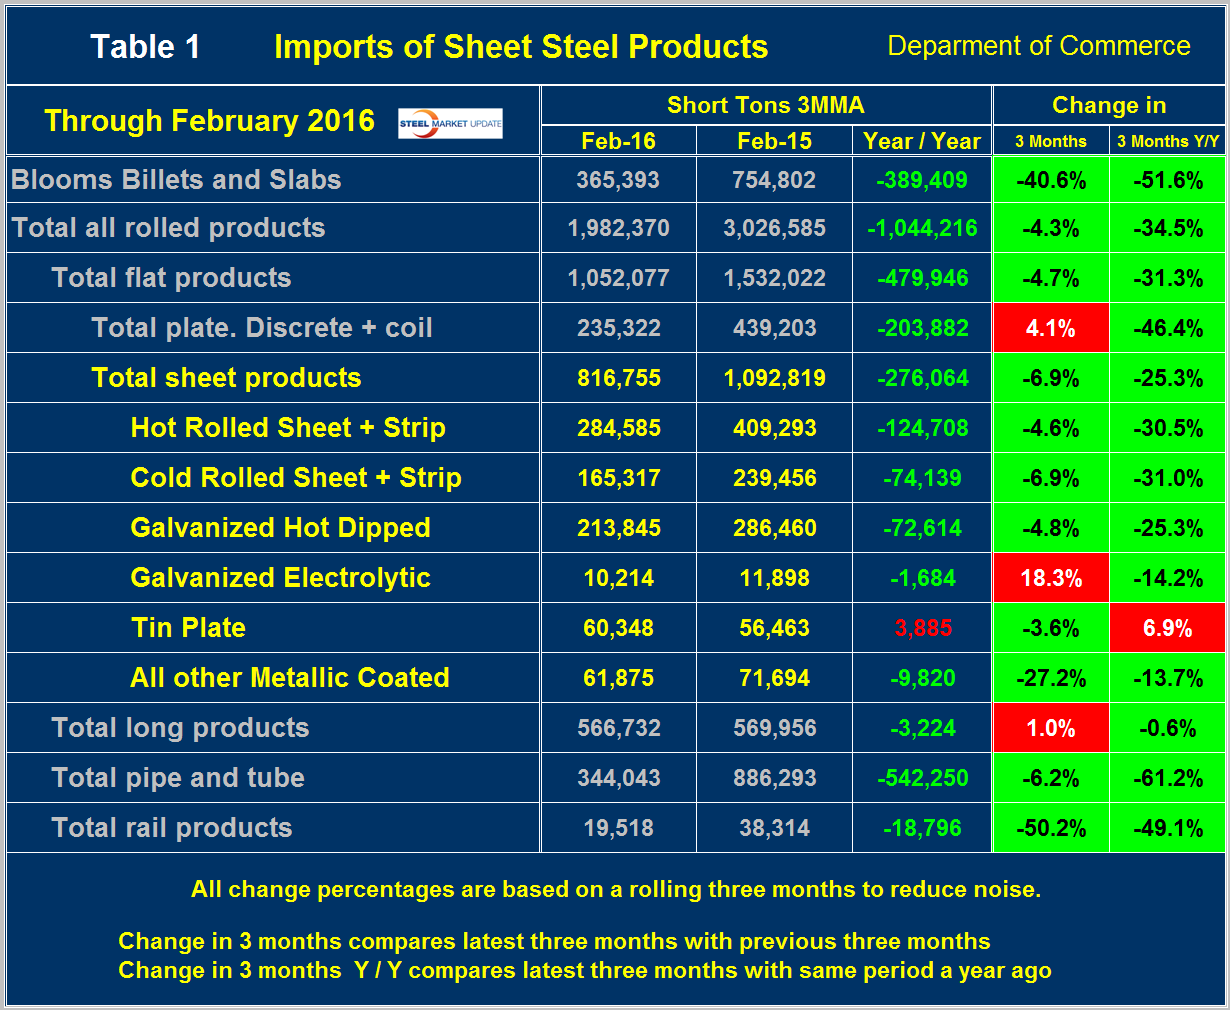
On a Y/Y basis the total of all rolled products was down by 34.5 percent, as total sheet products was down by 25.3 percent. Tubular products were down by 61.2 percent. Semi-finished slabs, blooms and billets were down by 40.6 percent 3M/3M and down by 51.6 percent Y/Y. The total volume of hot worked products at 1,982,370 tons in February on a 3MMA basis was down by over a million tons from February 2015. The total hot worked tonnage was down by 4.3 percent 3M/3M and down by 34.5 percent Y/Y. These trends indicate that in the big picture the overall volume of imports is falling fast but in the case of plate and electro-galvanized, imports increased 3M/3M. The color codes in Tables 1 and 2 for the three month and year over year change show which products are improving and which have still experienced import volume increases in these two time frames.
Table 2 shows the same analysis for long products and it is immediately obvious that the situation is far different than for flat rolled. For total long products the tonnage through February on a 3MMA basis was almost the same as last year and the volume increased by 1.0 percent 3M/3M. On a Y/Y basis, light shapes, heavy structurals and wire rod increased substantially.
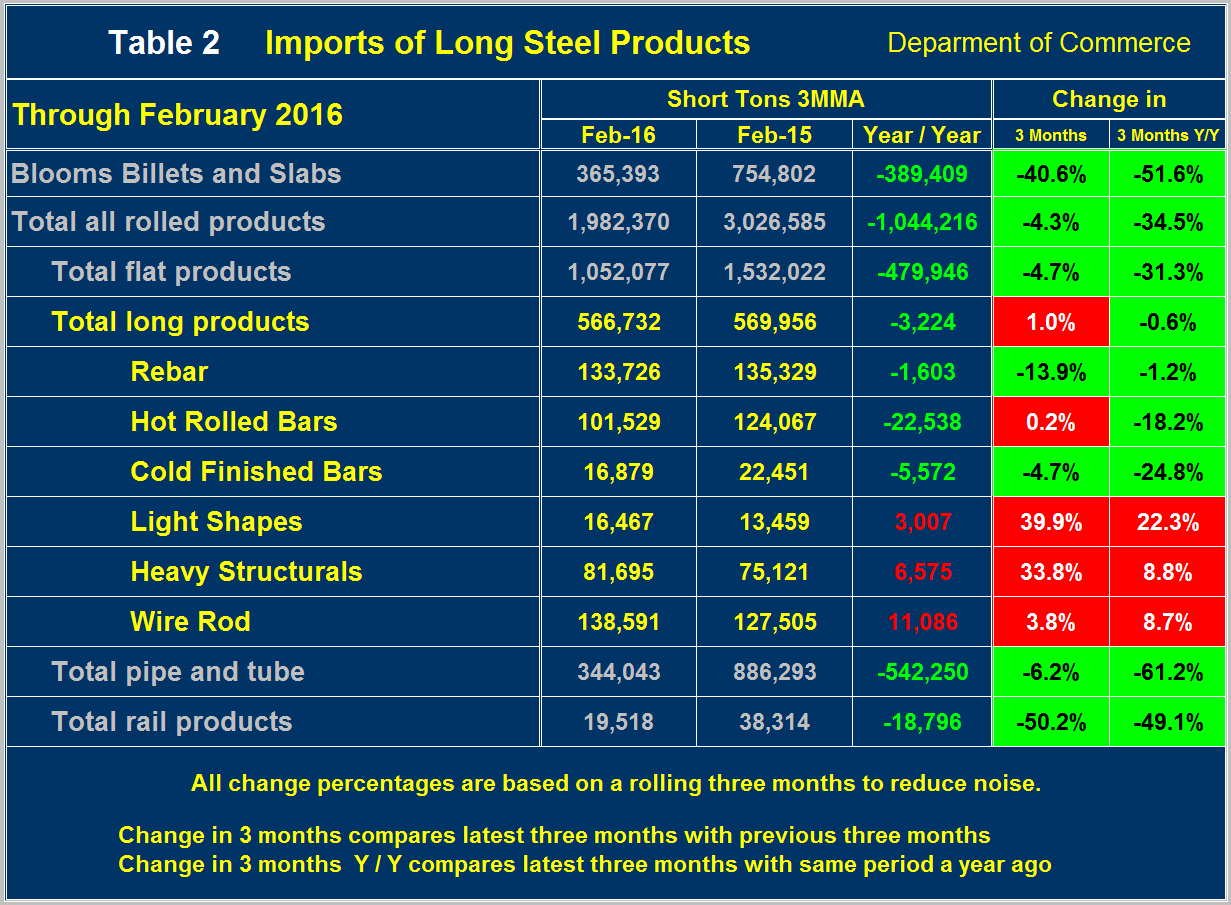
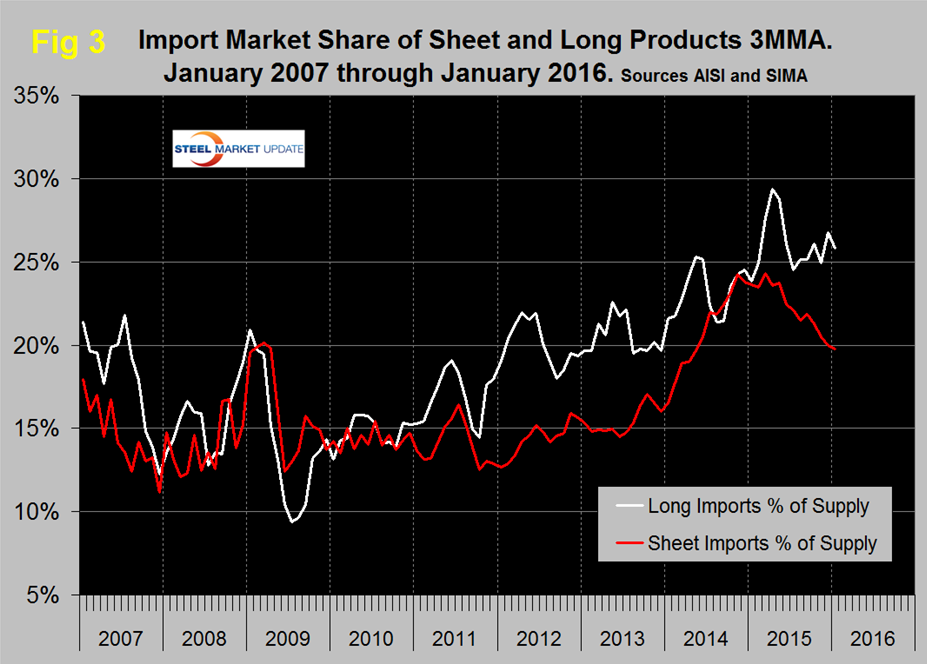
Figure 3 shows the import market share of sheet and long products through January which is the latest data available for total steel supply. The import market share of sheet products peaked at 24.3 percent in March and at 19.7 percent in January was the lowest since May 2014. Long product import market share peaked at 29.4 in April, declined to 24.5 percent in July then increased erratically to 25.8 percent in this latest data.
Net imports equals imports minus exports and our analysis is based on the final volumes through January. We regard this as an important look at the overall trade picture and its effect on demand at the mill level. Figure 4 shows that net sheet product imports on a 3MMA basis at 494,300 tons in January were down by 310,000 tons year over year.
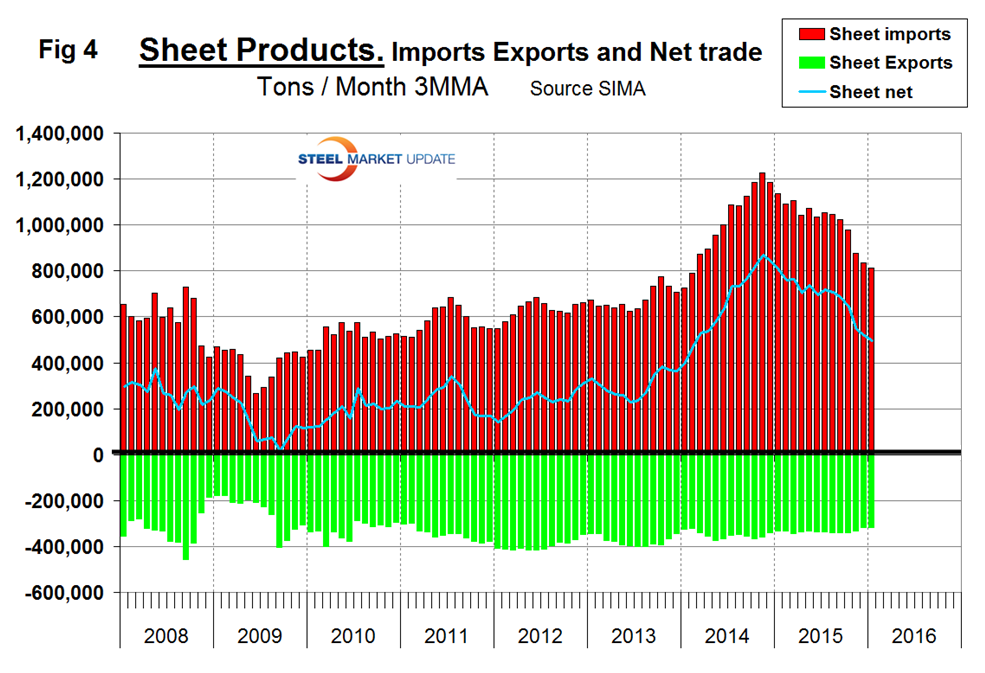
Compared to imports, exports have been relatively consistent for almost eight years. Net sheet steel imports are still strong by historical standards and we believe there are two main drivers. The trade weighted value of the US $ is increasing which makes our exports less attractive to foreign buyers. It makes the US domestic market more attractive to foreign sellers because they reap more in their own currencies and it makes imports more attractive to domestic buyers. The second reason is that steel demand in the US is better than in the world at large. Global steel production contracted by 5.8 percent year over year in 3 months through January and that trend is accelerating. Global steel capacity continues to increase and it is estimated that excess capacity is now about 486 million tons or 23.5 percent. The US is an attractive destination for this excess most of which is in China. About 70 percent of China’s industry is government owned so making money is not the top priority. Maintaining jobs is. Declining steel demand abroad, decent demand in the US and a skyrocketing US dollar will be a headwind for US steel producers for the immediate future.
Explanation: Steel Market Update publishes several import reports ranging from this very early look using licensed data to the very detailed analysis of final volumes by product, by district of entry and by source nation which is available on the premium member section of our web site. The early look, the latest of which you are reading now has been based on three month moving averages (3MMA) using the latest licensed data, either the preliminary or final data for the previous month and final data for earlier months. We recognize that the license data is subject to revisions but believe that by combining it with earlier months in this way gives a reasonably accurate assessment of volume trends by product as early as possible. We are more interested in direction than we are in absolute volumes at this stage. The main issue with the license data is that the month in which the tonnage arrives is often not the same month in which the license was recorded. In 2014 as a whole our data showed that the reported licensed tonnage of all carbon and low alloy products was 2.3 percent less than actually receipts, close enough we believe to confidently include licensed data in this current update. The discrepancy declined continuously during the course of the twelve month evaluation as a longer time period was considered.


