Market Data

March 11, 2016
Shipments and Supply of Sheet Products through January 2016
Written by Peter Wright
This report summarizes total steel supply from 2007 through January 2016 and year on year changes. It then compares domestic mill shipments and total supply to the market. It quantifies market direction by product and enables a side by side comparison of the degree to which imports have absorbed demand. Sources are the American Iron and Steel Institute and the Department of Commerce with analysis by Steel Market Update.
Table 1 shows both supply and mill shipments of sheet products (shipments includes exports) side by side as a three month average through January, for both 2015 and 2016.
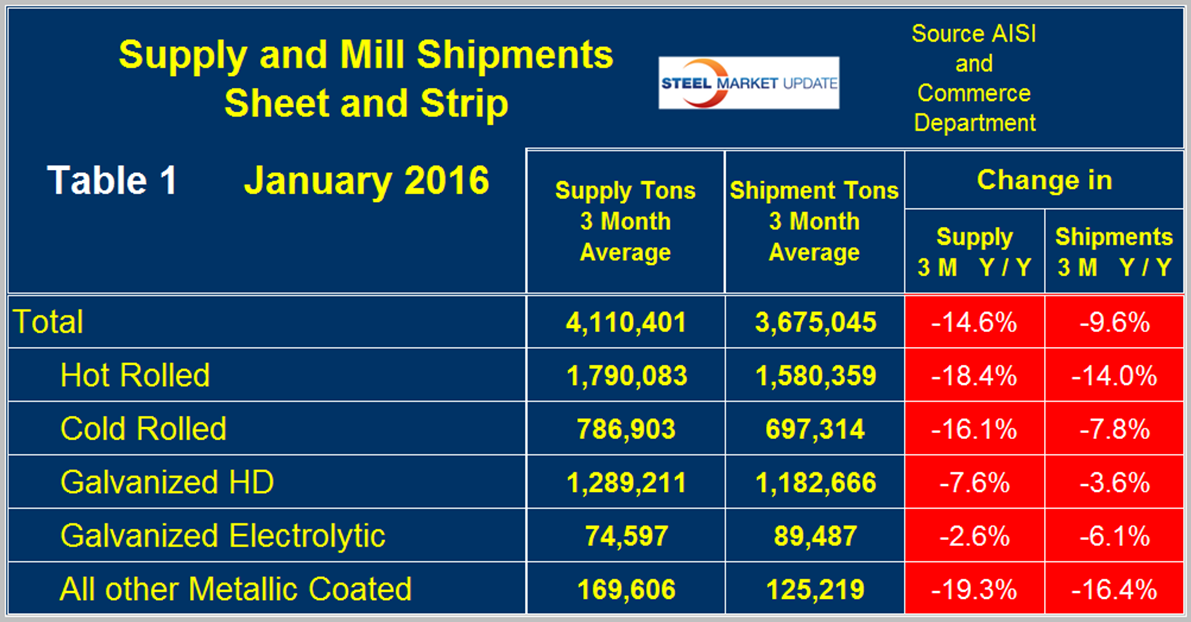
Comparing these two time periods total supply to the market was down by 14.6 percent and shipments were down by 9.6 percent. The fact that supply was down by more than shipments means that imports put less pressure on the market than they did in most of 2015. Table 1 breaks down the total into the individual sheet products and it can be seen that for the big three items, HR, CR and HDG, shipments all declined by less than supply. Supply of hot rolled was down by 18.4 percent and shipments were down by 14.0 percent, cold rolled supply was down by 16.1 percent as shipments were down by 7.8 percent. HDG supply was down by 7.6 percent as shipments declined 3.6 percent. This means that in all three cases imports gave up some ground. Electro-galvanized lost ground to imports as supply was up by 2.6 percent and shipments were down by 6.1 percent. Electro-galvanized enjoys a trade surplus which weakened in January. Other metallic coated products (OMC, mainly Galvalume) had supply down by 19.3 and shipments down by 16.4 percent. A review of supply and shipments separately for individual sheet products is given below.
Apparent Supply is a proxy for market demand and is defined as domestic mill shipments to domestic locations plus imports. In three months through January 2016 the average monthly supply of sheet and strip was 4.1 million tons, down by 14.6 percent year over year as mentioned above. In the three months through January supply was down by 10.6 percent compared to the period August through October. The short term decline (3 months) is less than the long term (12 months) which means that the decline is slowing. Table 2 shows the change in supply by product on this basis through January. Momentum was positive for HR, CR and OMC products. Hot dipped and electro-galvanized both had negative momentum.
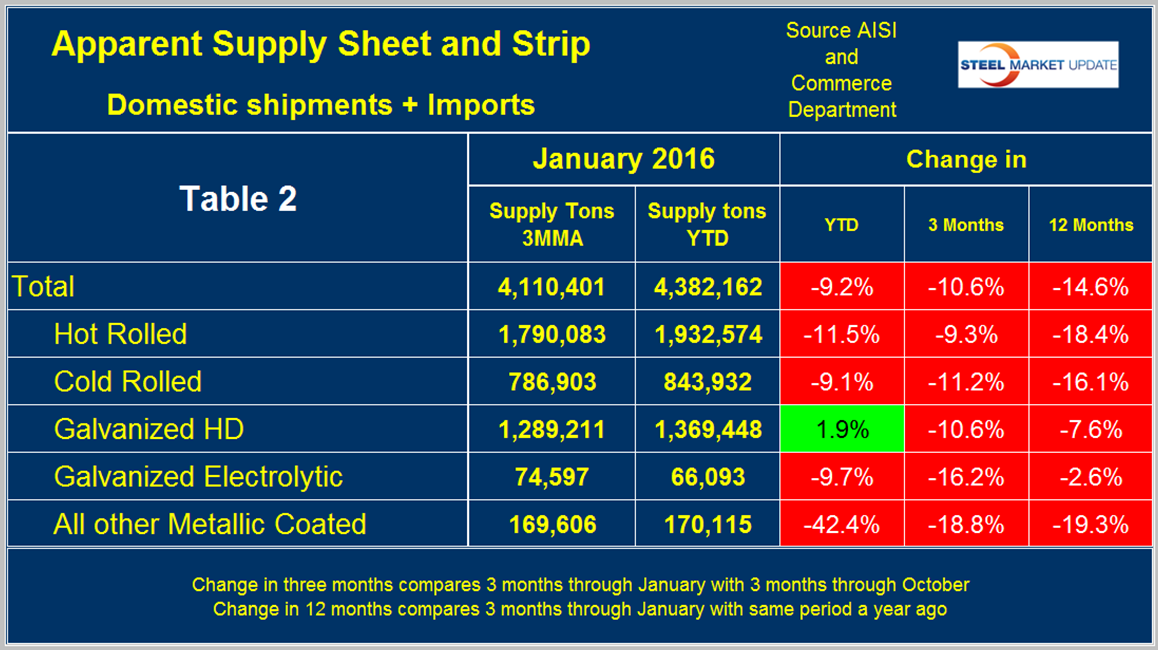
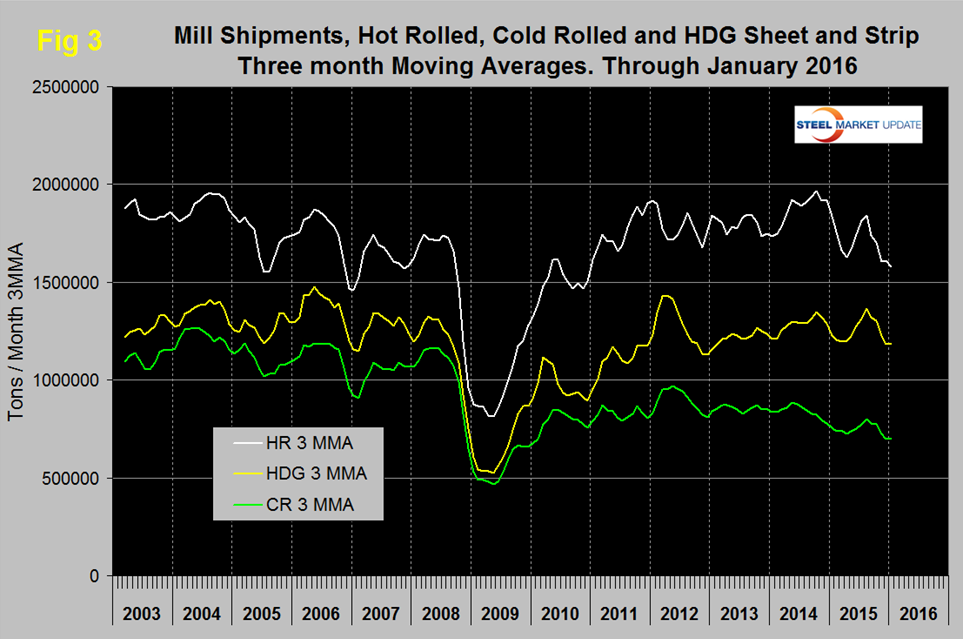
Figure 1 shows the long term supply picture for the three major sheet and strip products, HR, CR and HDG since January 2003 as three month moving averages.
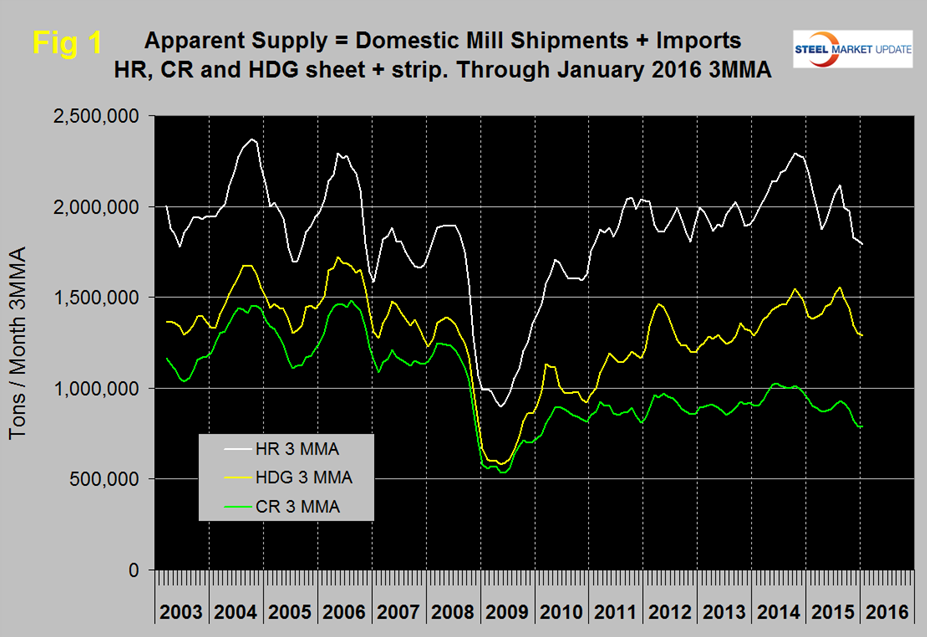
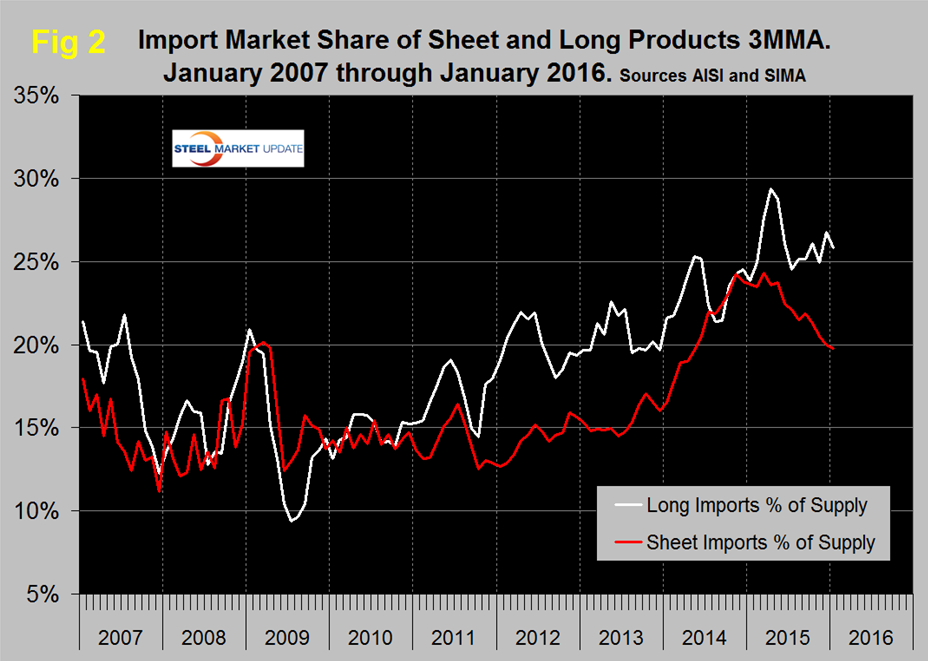
Figure 2 shows import market share of sheet products and includes long products for comparison. Based on a 3MMA the import market share of sheet products has declined more or less continuously since March 2015 when it was 24.3 percent to 19.7 percent in January. Long product import market share peaked at 29.4 in April, declined to 24.5 percent in July then increased erratically to 25.8 percent in this latest data.
Mill Shipments
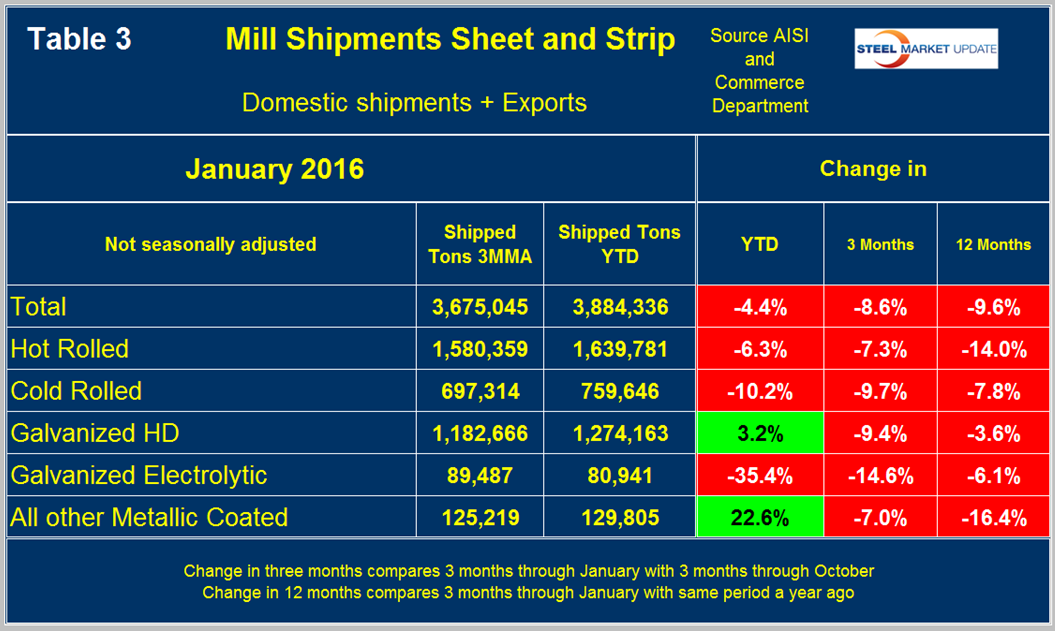
Table 3 shows that total shipments of sheet and strip products including hot rolled, cold rolled and all coated products were down by 9.6 percent in 3 months through January year over year and down by 8.6 percent comparing three months through January with three months through October.
The numbers in this report illustrate why it’s necessary to look at different time periods to get the whole picture. Individual products performed quite differently, HR and OMC had positive momentum meaning that the decline is slowing but for CR and HDG the decline accelerated in three months through January. Figure 3 puts the results for the three main products into the long term context since January 2003.