Market Data

March 18, 2016
SMU New Apparent Excess/Deficit Inventory Forecast
Written by John Packard
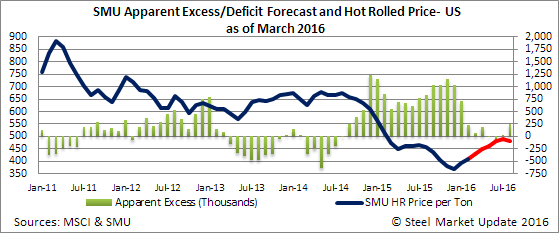
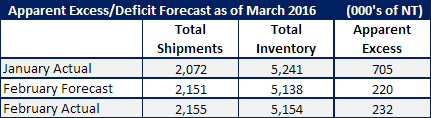
Last month we forecast that February carbon flat rolled shipments would be down 5 percent year over year and that the steel receipts would be 10 percent lower than their 3 year average. We projected total shipments at 2,151,000 tons and the MSCI reported shipments of 2,154,700 tons. We projected inventories would end the month of February at 5,138,000 tons and the actual number came in at 5,154,000 tons. These are about as close to perfect that any forecaster could hope for.
The service center inventory Apparent Excess was forecast to be +220,000 tons (which is getting darn close to balanced, especially if the trend is for service centers to continue to reduce inventories in March) while the actual number was +232,000 tons.
New Forecast for March & Beyond
We are going to continue to forecast shipments to be 5 percent below year ago levels for the month of March. Based on our forecast we expect the flat rolled service centers to ship 2,373,000 tons of steel during the month.
Our forecast calls for the service centers to receive 5 percent fewer tons than the three month average which, if correct and combined with shipments would leave inventories at 4,930,000 tons at the end of March.
If correct, at the end of March the Apparent Inventory Excess will have declined to 72,000 tons.
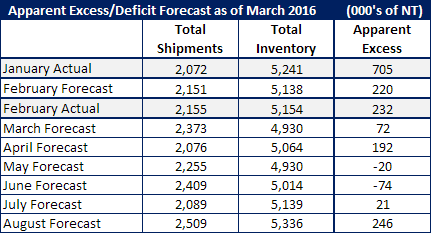
As we look out into the future months we play with the formula a bit as the year-over-year comparables become easier to hit (due to the slowdown in shipments during the second half 2015). Our Apparent Excess/Deficit model has inventories remaining relatively balanced for a number of months (subject to adjustment).
Again, if correct, a balanced inventory situation would require service centers to be active month to month buyers. This would improve the chances of the domestic mills being able to collect and keep price increases into the summer months.
Here is what we think will happen with prices over the next five months.