

Prices

April 11, 2016
Flat, Long, and Semi-Finished Imports through March 2016
Written by Peter Wright
Licensed data for March was reported by the Steel Import Monitoring System of the US Commerce Department on April 5th. An explanation of the methodology that we at SMU use to analyze the trade data is given at the end of this piece.
![]() Total rolled product licensed imports in the single month of March were 2,016,280 short tons which was almost exactly the same as the final February tonnage. Imports of semi-finished almost quadrupled from a very low volume of 167,517 tons in February to 782,181 tons in March. The March semi-finished tonnage, mainly slabs was the highest since February last year. We prefer not to dwell on single months results because of the extreme variability that can, and in the case of semis did occur in individual products. In the comments below we use only three month moving averages (3MMA) to get a more representative picture. The 3MMA of semi-finished through March was 453,478 tons, up by 56 percent from February. On this basis the volume of all rolled products was up by 1.1 percent, flat rolled was up by 0.4 percent of which sheet products were up by 0.2 percent. Long products were up by 1.3 percent and pipe and tube up by 6.9 percent.
Total rolled product licensed imports in the single month of March were 2,016,280 short tons which was almost exactly the same as the final February tonnage. Imports of semi-finished almost quadrupled from a very low volume of 167,517 tons in February to 782,181 tons in March. The March semi-finished tonnage, mainly slabs was the highest since February last year. We prefer not to dwell on single months results because of the extreme variability that can, and in the case of semis did occur in individual products. In the comments below we use only three month moving averages (3MMA) to get a more representative picture. The 3MMA of semi-finished through March was 453,478 tons, up by 56 percent from February. On this basis the volume of all rolled products was up by 1.1 percent, flat rolled was up by 0.4 percent of which sheet products were up by 0.2 percent. Long products were up by 1.3 percent and pipe and tube up by 6.9 percent.
Figure 1 shows the 3MMA through March licenses for semi-finished, flat and long products.
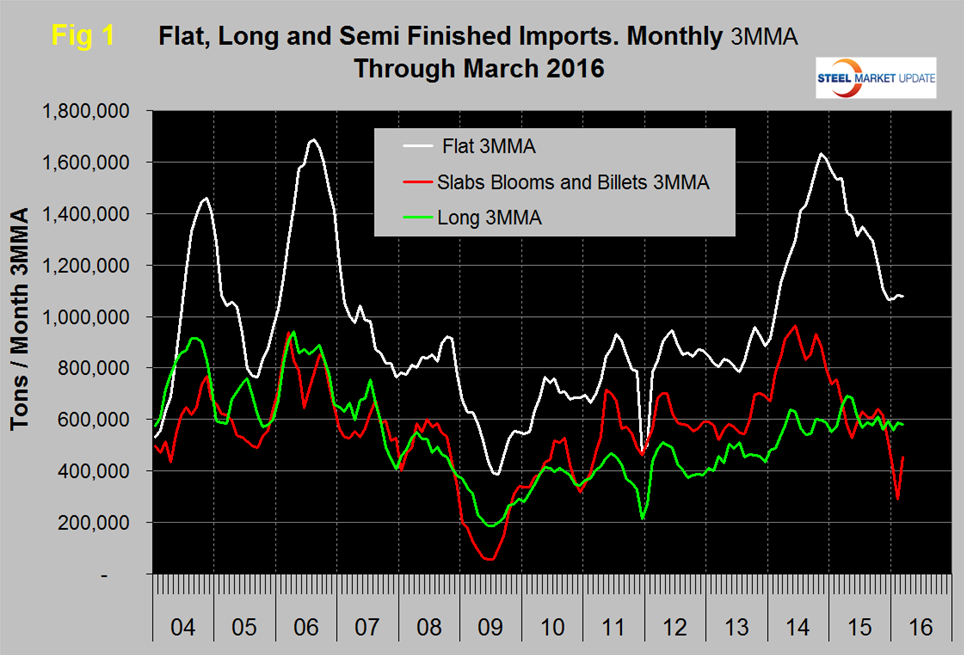
Flat includes all hot and cold rolled sheet and strip plus all coated sheet products plus both discrete and coiled plate. The 3MMA of flat rolled imports peaked at 1,634,000 tons in November 2014 and at 1,078,045 tons in March 2016 has been <1.1 million tons for four consecutive months. Long product imports have been stuck in the range 519,000 tons to 772,000 tons since March 2014 with no particular trend evident. In March the 3MMA of long product imports was 581,523 tons.
Figure 2 shows the trend of sheet and strip products since January 2004.
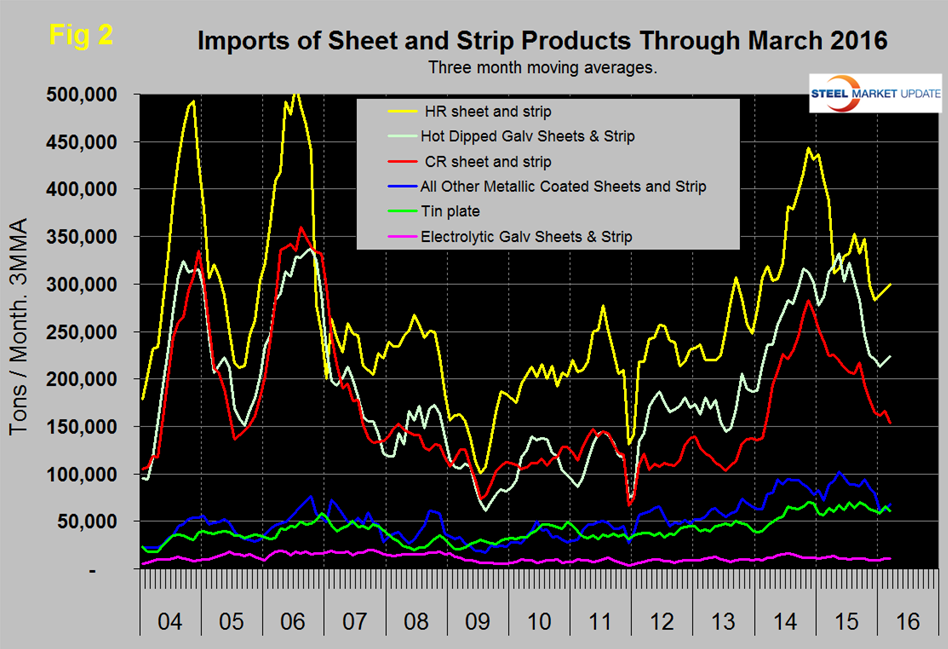
Hot rolled and HGD were up in March but cold rolled continued its downward trend. All other metallic coated (mainly Galvalume), tin plate and electro-galvanized were little changed in March.
Table 1 provides an analysis of major product groups and of sheet products in detail.
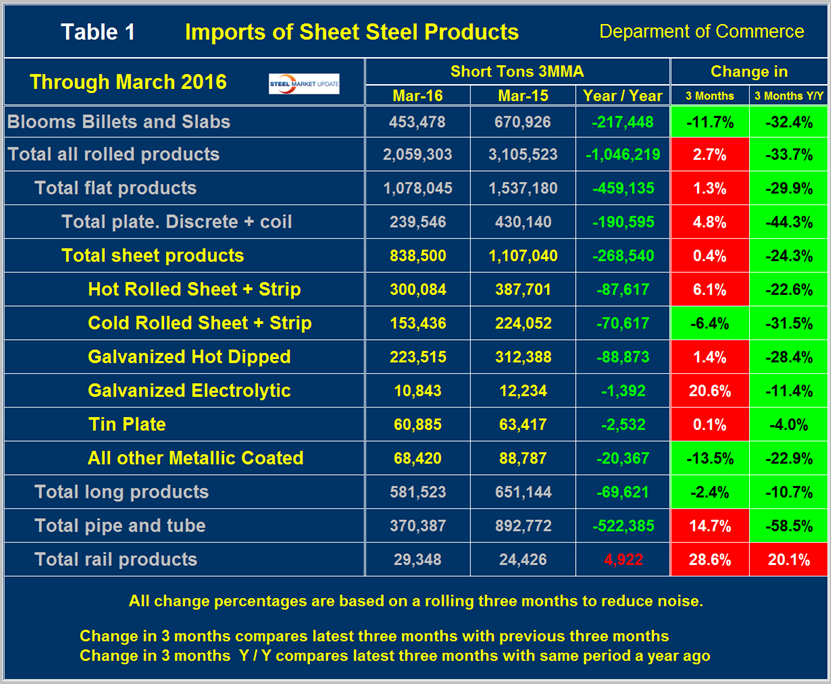
It compares the average monthly tonnage in the latest three months through March with both three months through December (3M/3M) and three months through March 2015 (Y/Y). On a Y/Y basis the total of all rolled products was down by 33.7 percent, as total sheet products were down by 24.3 percent. Tubulars were down by 58.5 percent. Semi-finished slabs, blooms and billets were down by 32.4 percent and long products were down by 10.7 percent. There was an increase in many categories on a 3M/3M basis as indicated by the color code red. Hot rolled was up by 6.1 percent as cold rolled declined by 6.4 percent. The total volume of hot worked products was down by over a million tons from March 2015. These trends indicate that in the big picture the overall volume of imports is falling fast but in the first quarter there was a small reversal compared to Q4 last year. The color codes in Tables 1 and 2 for the three month and year over year change show which products are improving and which have still experienced import volume increases in these two time frames.
Table 2 shows the same analysis for long products.
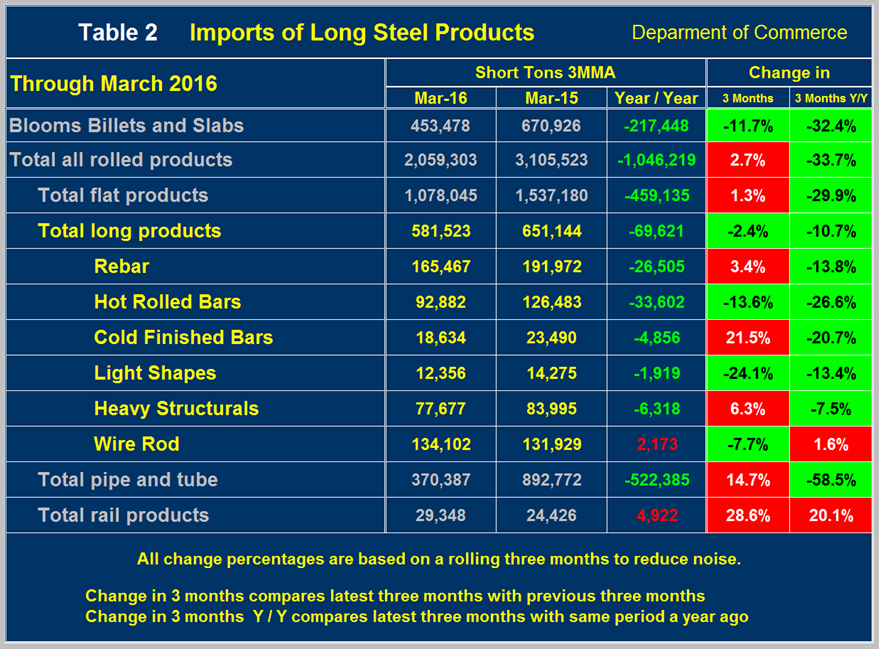
The total tonnage of long products was down by almost 70,000 tons per month Y/Y. Wire rod was the only product to have a volume increase on this basis.
Figure 3 shows the import market share of sheet and long products through February which is the latest data available for total steel supply.
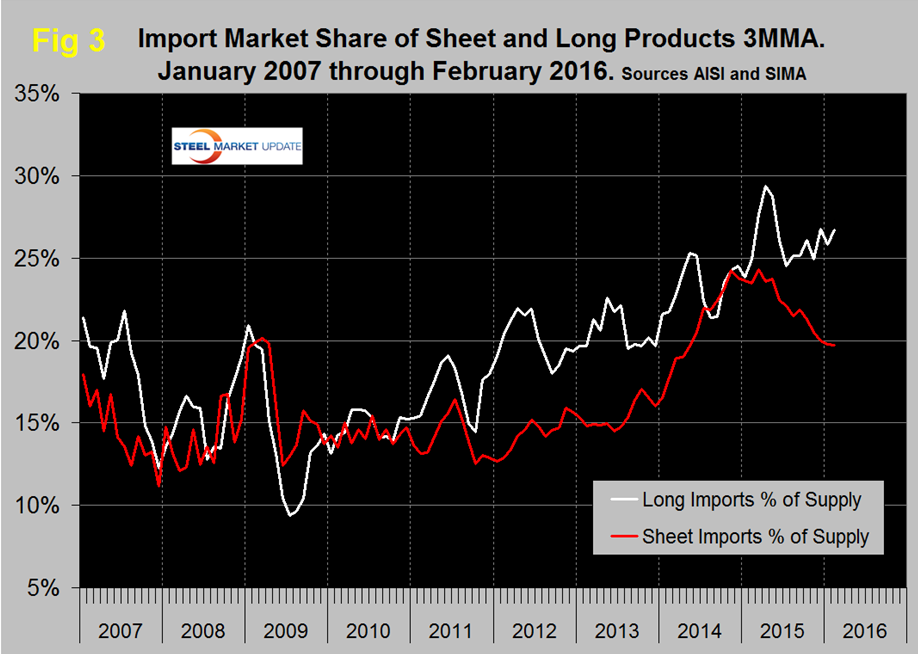
The import market share of sheet products peaked at 24.3 percent in March and at 19.7 percent in both January and February was the lowest since May 2014. Long product import market share peaked at 29.4 in April, declined to 24.5 percent in July then increased erratically to 26.7 percent in this latest data. This month we decided to take a look at import volume compared to market demand (total supply) for both sheet and long products to see if this view of the data would provide further insights. It did as shown in Figure 4 and Figure 5.
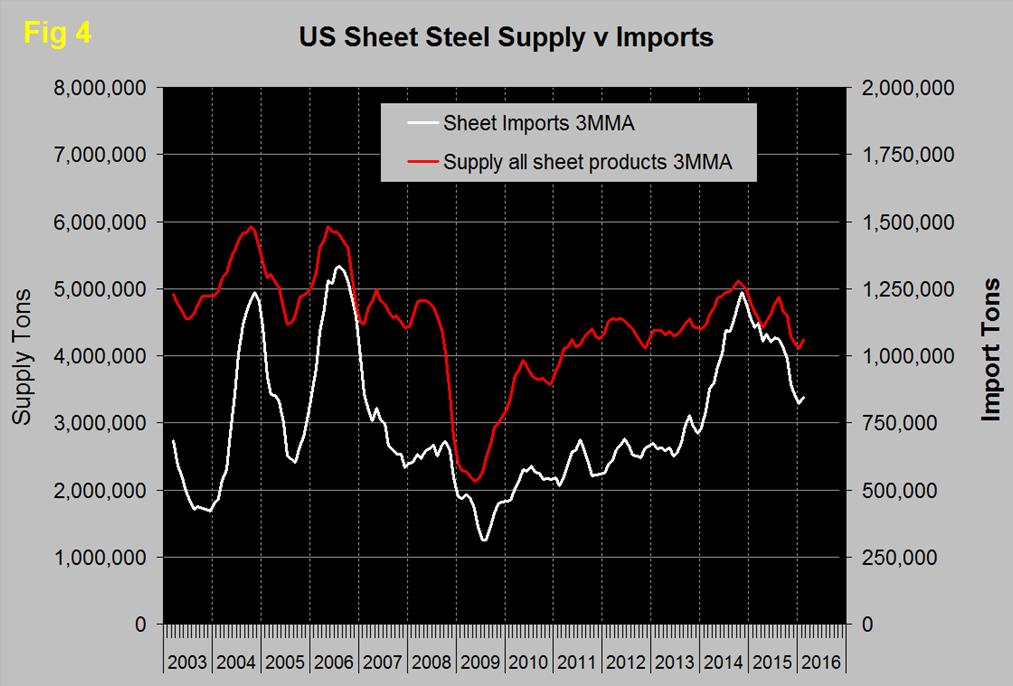
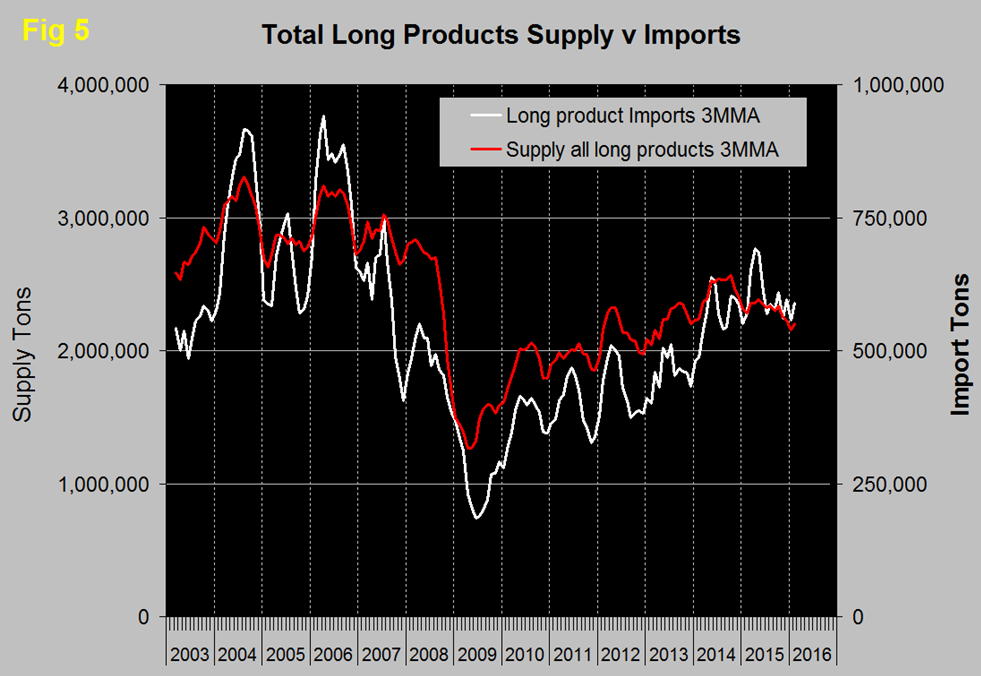
It’s possible to prove anything one wants to with double axis graphs like this by playing with the scales on the Y axes. With that in mind we have the same proportionality between demand and imports on both graphs. The import surges of 2004 and 2006 were clearly driven by demand for both product groups. The late 2014 surge in sheet product imports was not driven by a proportional increase in domestic demand and have dropped off much faster than the demand decline. We interpret this to be a manifestation of global over supply followed by buyer caution as trade case activity increased. In the case of long products, imports and demand have had an 89.9 percent correlation since January 2009. This indicates that almost all of the changes in import volume can be explained by factors in the domestic market and that import market share in the immediate future will not follow the lead of sheet products.
Net imports equals imports minus exports and our analysis is based on the final volumes through January. We regard this as an important look at the overall trade picture and its effect on demand at the mill level. Figure 6 shows that net sheet product imports on a 3MMA basis at 512,066 tons in February were down by 248,000 tons year over year.
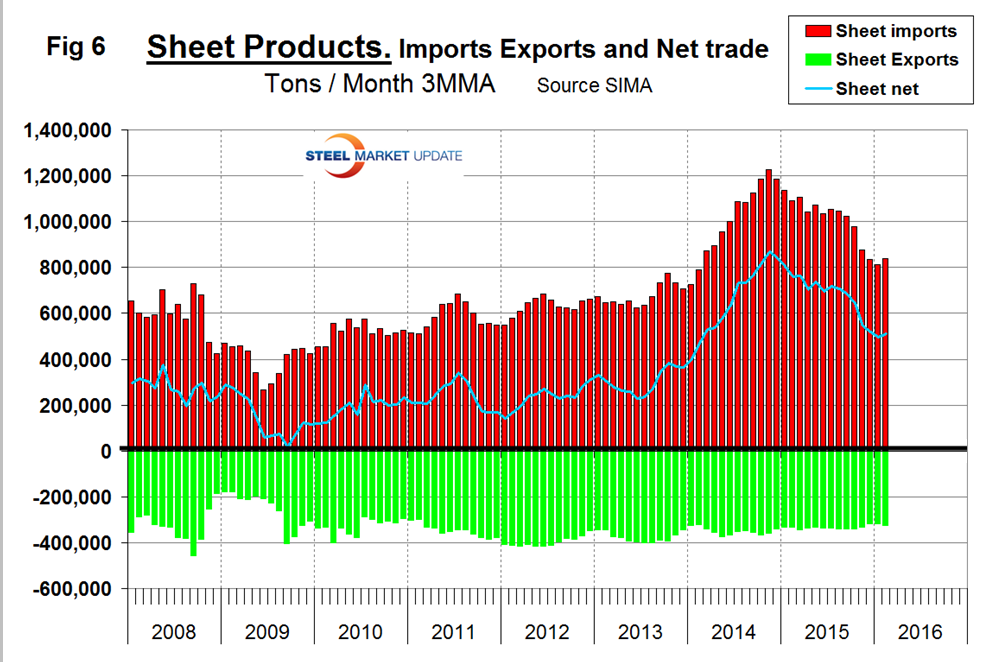
Compared to imports, exports have been relatively consistent for almost eight years. Net sheet steel imports are still strong by historical standards and we believe there are two main drivers. Even with the recent decline, the trade weighted value of the US $ is still higher than at any time since 2002 which makes our exports less attractive to foreign buyers and makes the domestic US market more attractive to foreign sellers because they reap more in their own currencies. The second reason is that steel demand in the US is better than in the world at large. Global steel production contracted by 5.6 percent year over year in 3 months through February and that trend is accelerating. Global steel capacity continues to increase and it is estimated that excess capacity is now about 486 million tons or 23.5 percent. The US is an attractive destination for this global excess. About 70 percent of China’s industry is government owned so making money is not the top priority. Maintaining jobs is. Declining steel demand abroad, decent demand in the US and a high value US dollar will be a headwind for US steel producers for the immediate future.
Explanation: The SMU publishes several import reports ranging from this very early look using licensed data to the very detailed analysis of final volumes by product, by district of entry and by source nation which is available on the premium member section of our web site. The early look, the latest of which you are reading now has been based on three month moving averages (3MMA) using the latest licensed data, either the preliminary or final data for the previous month and final data for earlier months. We recognize that the license data is subject to revisions but believe that by combining it with earlier months in this way gives a reasonably accurate assessment of volume trends by product as early as possible. We are more interested in direction than we are in absolute volumes at this stage. The main issue with the license data is that the month in which the tonnage arrives is often not the same month in which the license was recorded. In 2014 as a whole our data showed that the reported licensed tonnage of all carbon and low alloy products was 2.3 percent less than actually receipts, close enough we believe to confidently include licensed data in this current update. The discrepancy declined continuously during the course of the twelve month evaluation as a longer time period was considered.


