

Market Data

April 14, 2016
Oil and Gas Prices and Rotary Rig Counts in April 2016
Written by Peter Wright
The following analysis was done by Peter Wright who writes a number of analytical articles for Steel Market Update. The energy markets are key markets for steel so it is important for our readers to understand oil and gas prices as well as the tubular products associated with drilling and transportation of oil and gas.
Figure 1 shows historical oil and gas prices since January 2000. The daily spot price of West Texas Intermediate (WTI) closed at $40.46 on April 11th which was the highest since December 3rd last year according to the latest daily figure available from the Energy Information Administration (EIA).
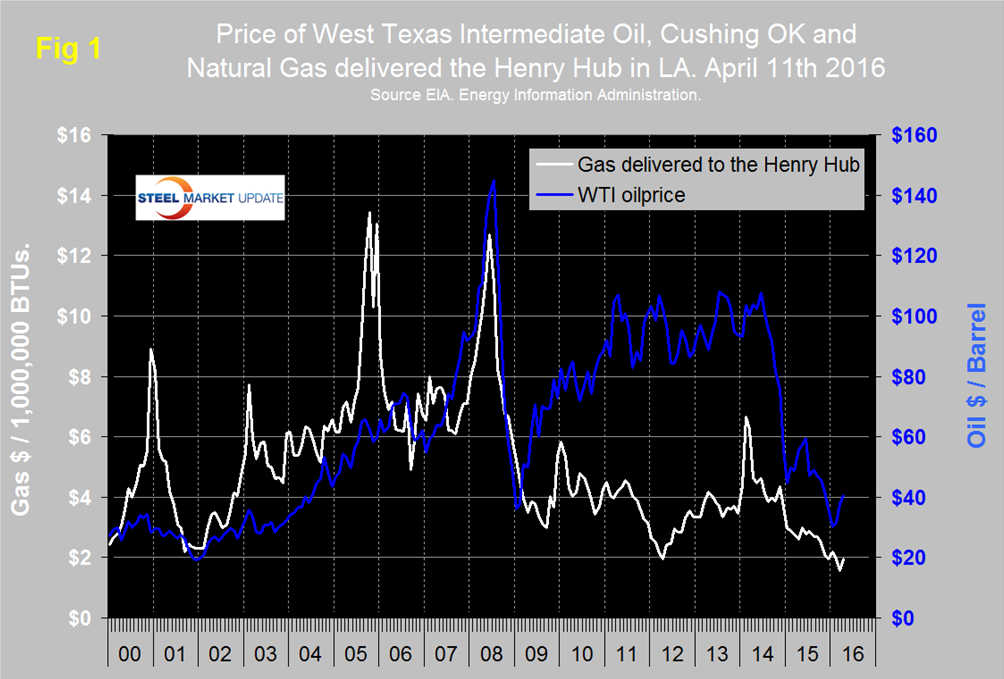
Brent closed at $41.58 on April 11th. On Wednesday Seeking Alpha reported comments by Saudi Arabia’s oil minister Ali al-Naimi in the al-Hayat newspaper that appear to contradict yesterday’s reports that Russia and the Kingdom had reached consensus on oil output ahead of an upcoming producer meeting in Doha. “Forget about this topic,” he told the paper, when asked about any possible reduction to his country’s production. Separately, the Seda weekly disclosed that Iran’s oil minister would not be attending the April 17 talks but would be sending a representative instead. Oil futures fell 2.1 percent to $41.27/bbl. Bespoke Investment Group reported on Wednesday that this week’s inventory report from the Department of Energy showed a much larger than expected build in crude oil inventories. While traders were expecting stockpiles to increase by 1 million barrels, the actual increase was nearly seven times that at 6.634 million. With this week’s build, US inventories are now back to multi-decade highs, and are currently 194 million barrels (52 percent) above their historical average for this time of year.
The price of natural gas, delivered the Henry Hub in Louisiana, closed at $1.95/MM BTS on April 8th, up from $1.57 in our last report on March 4th. April 8th was the latest data published by the EIA. The price has been trending down for two years and it remains to be seen if this recent increase is just noise. Natural gas is expected to fuel the largest share of electricity generation in 2016 at 33 percent, compared with 32 percent for coal. In 2017, natural gas and coal are both forecast to fuel 32 percent of electricity generation. Working natural gas inventories ended the winter heating season at 2,478 billion cubic feet (Bcf), exceeding the previous end-of-March record high of 2,473 Bcf, set in 2012, according to EIA’s Weekly Natural Gas Storage Report. Inventory withdrawals during the traditional heating season (November through March) were relatively limited this year because of winter weather that was the warmest on record and continued high levels of domestic natural gas production.
Figure 2 shows the apparent supply of the two main steel tubular products used in oil and gas production from January 2003 through February 2016 (Apparent supply is a proxy for demand.)
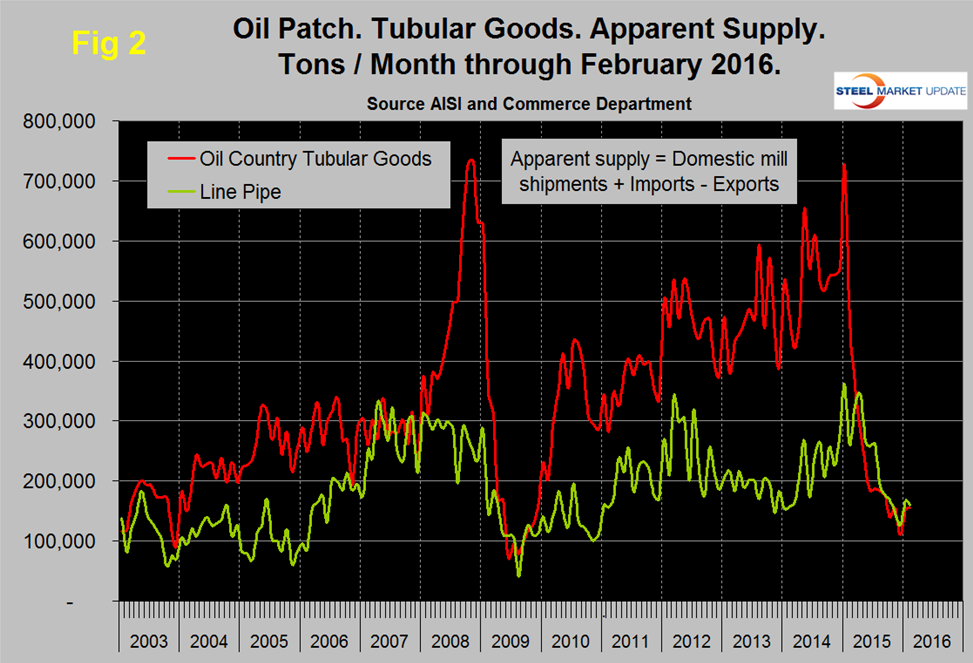
The demand for OCTD and line pipe improved in January and sustained that level in February but are still historically low. Imports of pipe and tube were down by 58.5 percent year/year in three months through February, which was more than any other product.
The total number of operating rigs in the US and Canada on April 8th was 484, down from 830 at the start of 2016 and down from 2,018 on January 2nd 2015. Year over year the total US and Canada rig count is down by 55.4 percent. Figure 3 shows the Baker Hughes US Rotary Rig Counts for oil and gas equipment in the US through April 8th (explanation below).
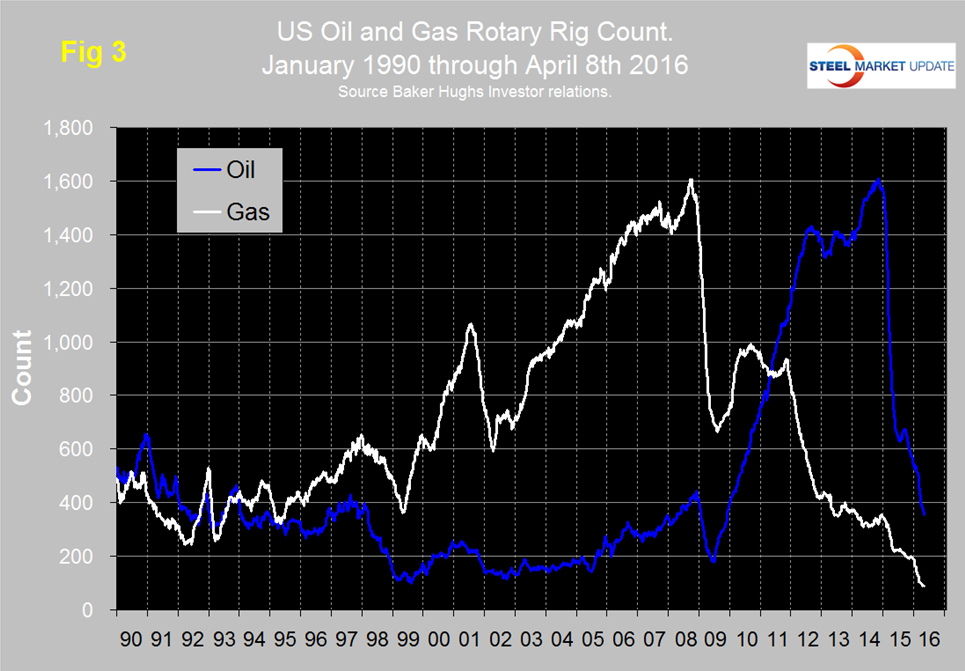
The decline in the US oil rig count hesitated in July and August but since then has been continuous, was down by 38 in the last month and this year it has been in free fall. Based on the most recent available data, the EIA estimates that oil production from hydraulically fractured wells now makes up about half of total U.S. crude oil production. U.S. crude oil production averaged an estimated 9.4 million barrels per day (b/d) in 2015, and it is forecast to average 8.7 million b/d in 2016 and 8.2 million b/d in 2017.
Following the recession there was a partial recovery in the gas rig count but since early 2012 the decline has been more or less continuous to the point that the number of operating rigs is now lower than at any time since our data began in January 1988.
On a regional basis in the US, the big three states for operating rigs are Texas, Oklahoma and North Dakota. Texas at 195 on April 8th was down from 213 on March 11th and down from 318 at the beginning of the year, Oklahoma at 63 was down from 87 at the beginning of the year and North Dakota at 27 was down from 53.
Baker Hughes Rotary Rig Count: These are a weekly census of the number of drilling rigs actively exploring for or developing oil or natural gas in the United States. Rigs are considered active from the time they break ground until the time they reach their target depth and may be establishing a new well or sidetracking an existing one. The Baker Hughes Rotary Rig count includes only those rigs that are significant consumers of oilfield services and supplies.


