Market Data

April 18, 2016
Service Center Apparent Excess to Move into Deficit by May
Written by John Packard
Every month Steel Market Update plugs in the MSCI shipment and inventory data for flat rolled steel and we run it through our model to determine if service centers are carrying too much inventory and by how much. We then forecast where we believe shipments and inventories will go over the next few months. From there we predict whether service centers will be under or over inventoried which is our Apparent Excess (over) or Deficit (under). We believe our model is important when considering service center ordering patterns (which have been increasing), how they will handle spot prices, support mill price increases, etc.
First, how did we do regarding our forecast for the month of March?
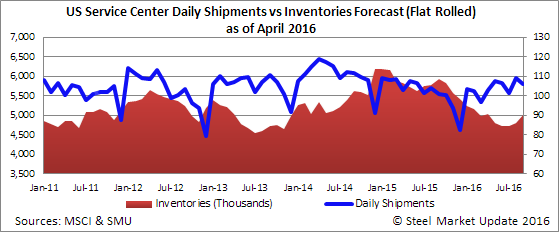
We believe service center shipments would be 5 percent lower than one year ago levels. Based on our formula we predicted shipments would be 2,373,000 tons and in actuality they were 2,228,000 tons. We got the direction correct but the degree was much larger than we expected by an additional 5.8 percent (total of 10.8 percent below 2015 levels).
We forecast inventories would come in at 4,930,000 tons and the actual number was 4,993,000 tons. Our forecast was base on daily receipts being 7 percent lower than the 3 year average. Receipts actually come in 10.5 percent below the 3 year average.
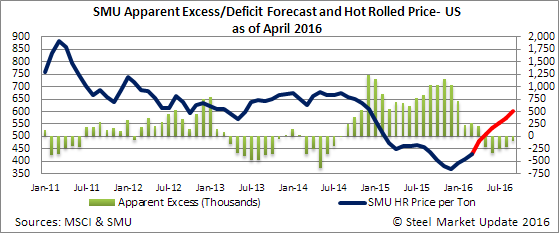
Our forecast called for service centers to drop Apparent Excess inventories to +72,000 tons. Based on our formula service center Apparent Excess is now +268,000 tons.
However, we have been forecasting a steady decline in carbon flat rolled inventories and they did drop from 5,154,000 tons to 4,993,000 tons.
April 2016 Forecast
When reviewing the 2015 numbers we noticed that April 2015 was the first month during the calendar year where shipments dropped by double digits compared to the previous year. April 2015 shipments were down -13.3 percent.
In looking at 2016 we have shipments remaining the same as year ago levels. If this is correct it will be the first time since January 2015 when shipments were the same or better than year ago levels (call me a diehard optimist).
We continue to forecast inventory receipts to be lower than the 3 year average by 5 percent.
If our forecast is correct shipments will be slightly below March 2016 levels and inventories will grow to 5,040,000 tons.
As the months progress we have shipments remaining either the same or beginning to gain traction against the weak numbers posted during the same months in 2015. The higher shipment rates will keep inventories below 5 million tons and will eliminate the Apparent Excess by May at which point inventories will be in an Apparent Deficit where they will remain until September.
Our forecast is for prices to continue to move higher during this time frame reaching and possibly exceeding $600 per ton.