

Market Data

April 28, 2016
SMU Survey Indicates Positive Demand Trend
Written by John Packard
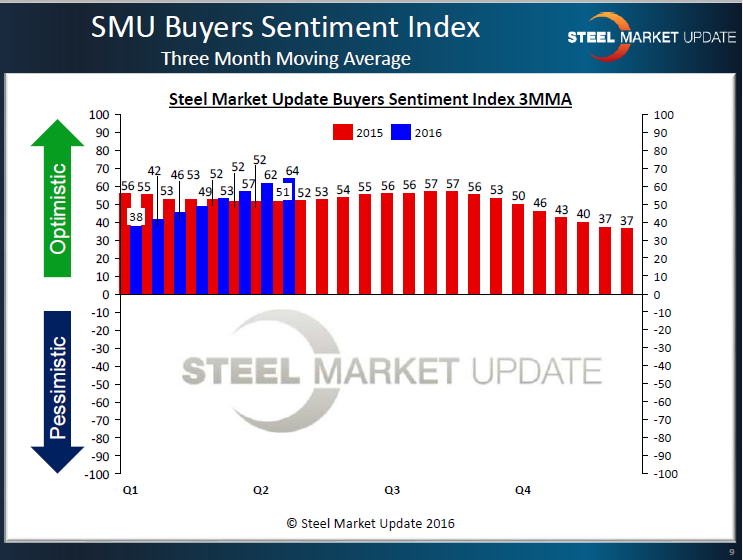
Last week Steel Market Update reported our Steel Buyers Sentiment Index as being at record highs. Buyers and sellers of flat rolled steel are very optimistic about their company’s ability to be successful not only in the current market but three to six months out into the future as well. When looking at Sentiment from a three month moving average (3MMA) which takes out any minor gyrations that can affect a single data point, we can clearly see the optimistic trend growing ever since the domestic steel mills began announcing, and more importantly – collecting, price increases.
Besides pricing another important factor driving this optimistic fervor within the flat rolled segment of the steel industry is related to demand. We are bombarded daily with conflicting economic data, some suggesting doom and gloom while other data is more optimistic.
Steel Market Update conducts our flat rolled steel market trends analysis twice per month where we canvass buyers and sellers of flat rolled steel. One of our goals is to watch demand and demand trends from both the manufacturing and distribution sectors of the industry. Our results have been indicating an improving demand situation according to those who respond to our surveys.
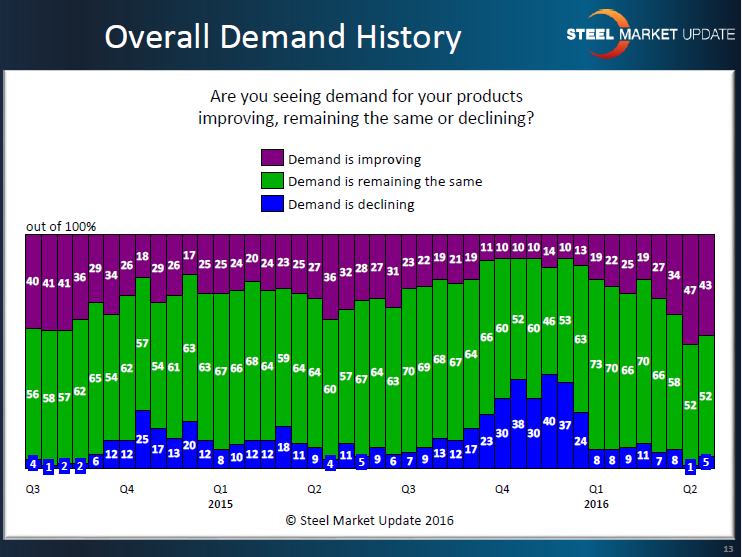
In the first graphic below, we ask everyone who participated in last week’s questionnaire whether they were seeing demand as improving, declining or remaining the same. As you can see from the purple bars at the top of the graphic the trend has been toward improving demand and this year looks to be much better than last.
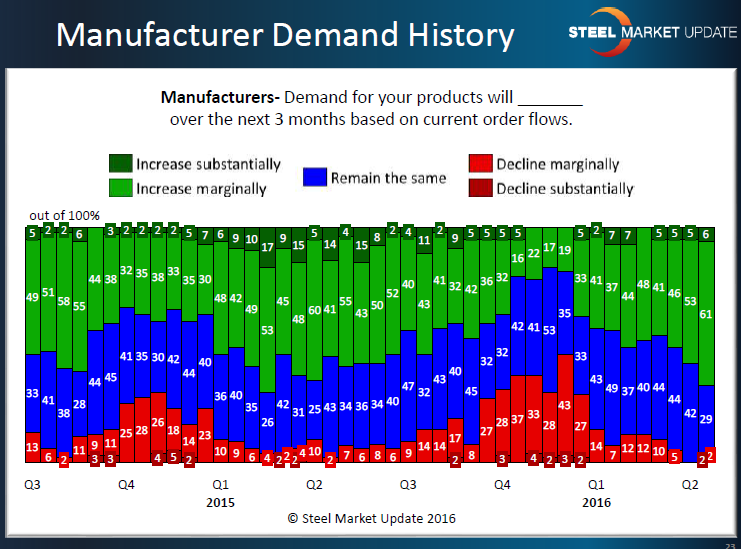
It is important to look at trends from more than one perspective and we do that in our bi-monthly trends analysis. We collect data from manufacturing companies separately from distributors in an effort to better understand is a trend is being seen by all segments of the flat rolled steel industry.
In the next graphic (see below) we ask manufacturing companies how they are seeing demand for their products over the next three months based on their order flows. As you can see, after a much more pessimistic 4th Quarter than what was seen the prior year, manufacturing companies quickly reversed trend and are expecting stronger demand.
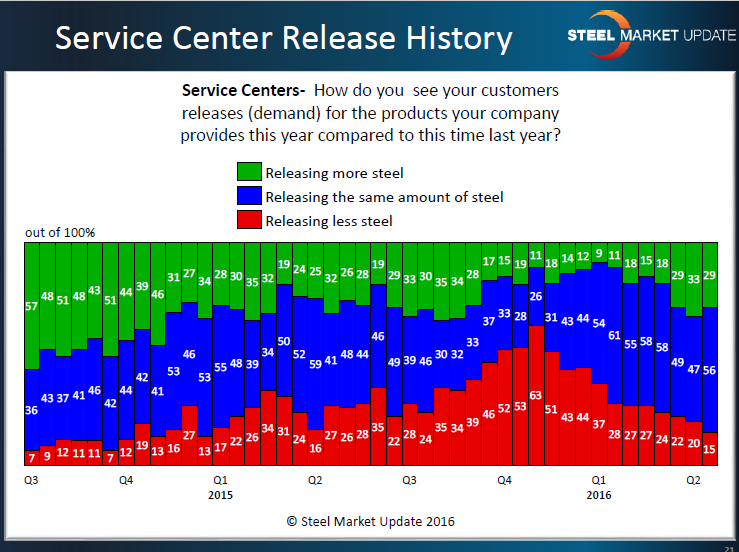
We then look at the releases being made by end users through their distributors (service centers) to see if the reversal in trend noted in the manufacturing responses carries over to the releases being made at their suppliers. As you can see by the red bars which indicate those service centers reporting their customers are releasing less steel than year ago levels, we are seeing a reversal of the negative trend which began in the 3rd Quarter 2015.
SMU anticipates a continuation of the growth in demand which we attribute to seasonal factors as well as growing strength in the construction related industries which are well represented in our survey. This coincides with the optimistic reports we are hearing out of the various steel mills as they announce earnings and provide guidance for the balance of the year to analysts.


