

Analysis

May 9, 2016
Construction Expenditures through March 2016
Written by Peter Wright
Each month the Commerce Department issues its Construction Put in Place (CPIP) data, usually on the first working day covering activity two months earlier. March data was released on Monday May 2nd.
![]() Construction Put in Place is based on spending work as it occurs, estimated for a given month from a sample of projects. In effect the value of a project is spread out from the project’s start to its completion. This is different from the starts data published by the Census Bureau for residential construction, by Dodge Data & Analytics and Reed Construction for non-residential and Industrial Information Resources for industrial construction. In the case of starts data the whole project is entered to the data base when ground is broken. The result is that the starts data can be very spiky which is not the case with CPIP.
Construction Put in Place is based on spending work as it occurs, estimated for a given month from a sample of projects. In effect the value of a project is spread out from the project’s start to its completion. This is different from the starts data published by the Census Bureau for residential construction, by Dodge Data & Analytics and Reed Construction for non-residential and Industrial Information Resources for industrial construction. In the case of starts data the whole project is entered to the data base when ground is broken. The result is that the starts data can be very spiky which is not the case with CPIP.
At SMU we analyze the CPIP provided by the Department of Commerce with the intent of providing a clear description of activity in this steel consuming sector. Please see the end of this report for more detail on how we perform this analysis and structure the data.
Total Construction
Total construction had a double digit growth rate from May through November last year on a y/y basis. In December and January growth slowed to 9.1 percent but in February and March growth bounced back to a monthly average of 11.1 percent. In the last twelve months construction growth has been as strong as at any time since our data stream began over twenty years ago. All growth measures are on a three month moving average (3MMA) basis year over year which eliminates seasonality.
March expenditures were $75.38 billion which breaks down to $55.5B of private work, $16.2B of state and locally (S&L) funded work and $1.7 B of federally funded (Table 1).
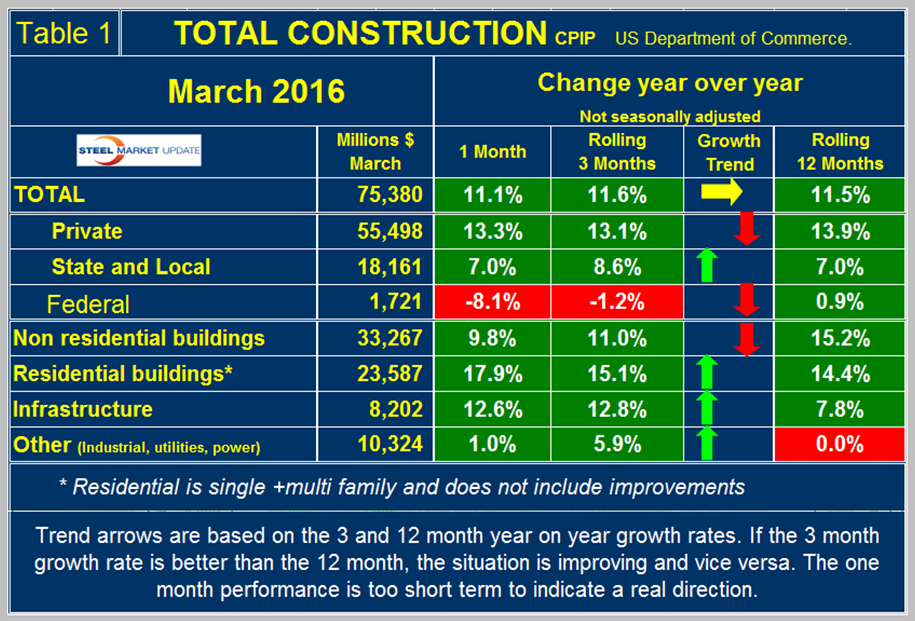
The red and green arrows in all four tables in this report show momentum. March on a 3MMA basis had an increase in year over year growth of 11.6 percent which was essentially the same as the 11.5 percent growth on a rolling 12 months basis. This means that the growth rate is flat with almost zero momentum. Total construction will reach the pre-recession level before the end of this year if the present growth rate is maintained (Figure 1).
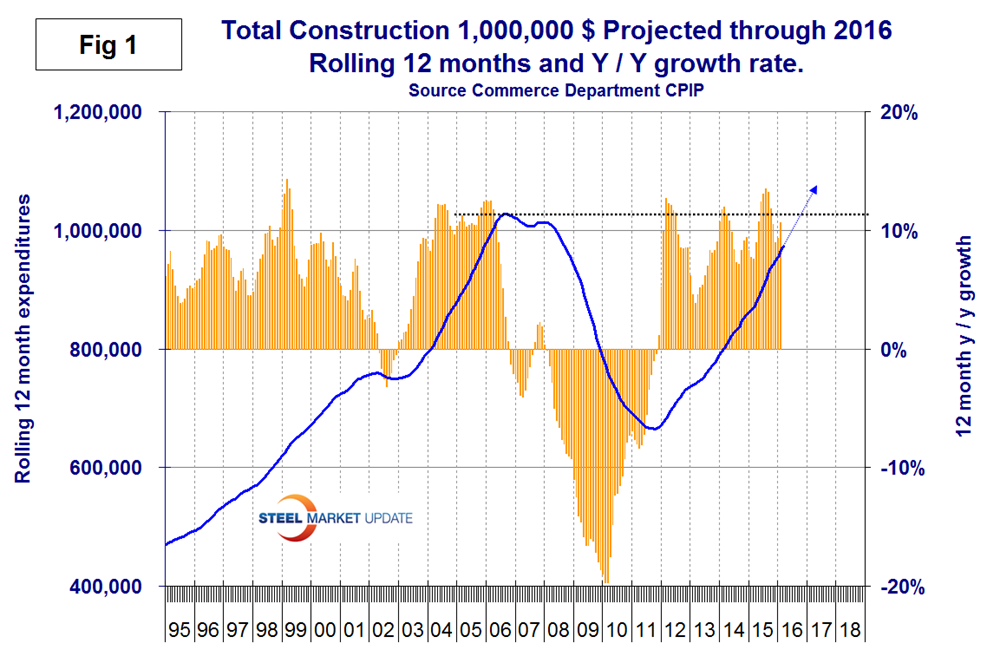
The 11.6 percent growth of total construction y/y was led by private work up by 13.1 percent. State and locally financed work was up by 8.6 percent and Federal was down by 1.2 percent. Momentum was negative for private and federal work but positive for state and local. Building construction had negative momentum but infrastructure, industrial, utilities and power accelerated. We consider four sectors within total construction. These are non-residential, residential, infrastructure and other. The growth rate of non-residential buildings, residential buildings and infrastructure are all at double digit rates. The growth rate of “Other” which is a catch all for industrial, utilities and power became very negative at the time of the oil price collapse but has recovered to positive growth in the last seven months. The growth rate of total construction is shown by the brown bars in Figure 1. The pre-recession peak of total construction on a rolling 12 month basis was $1,028 B in 12 months through September 2006. The low point was $665.1 B in 12 months through October 2011. The 12 month total through the latest data of March 2016 was $973 B. July 2015through March 2016 were the first months to exceed $900 B since April 2009 when the recession was gaining traction.
Private Construction
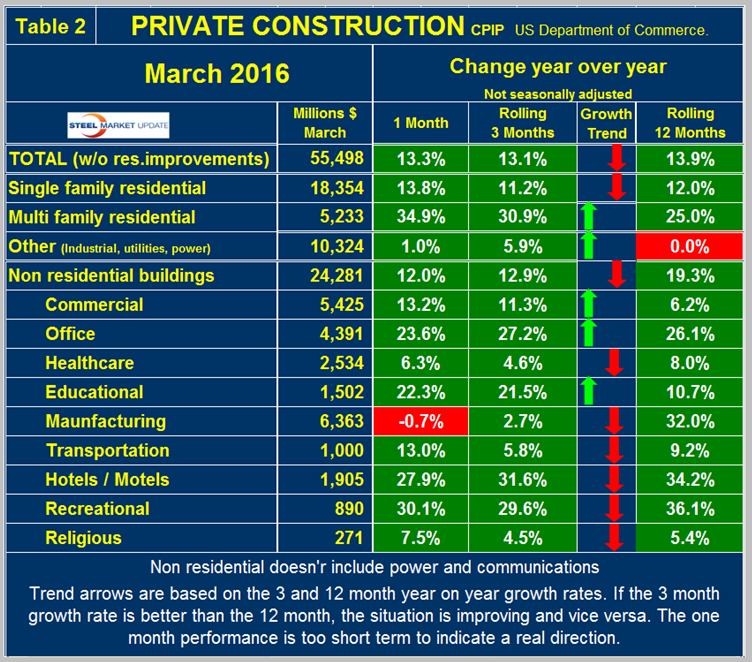
Table 2 shows the breakdown of private expenditures into residential and non-residential and sub-sectors of both.
The growth rate of private construction was 13.1 percent in the last three months as shown by the brown bars in Figure 2.
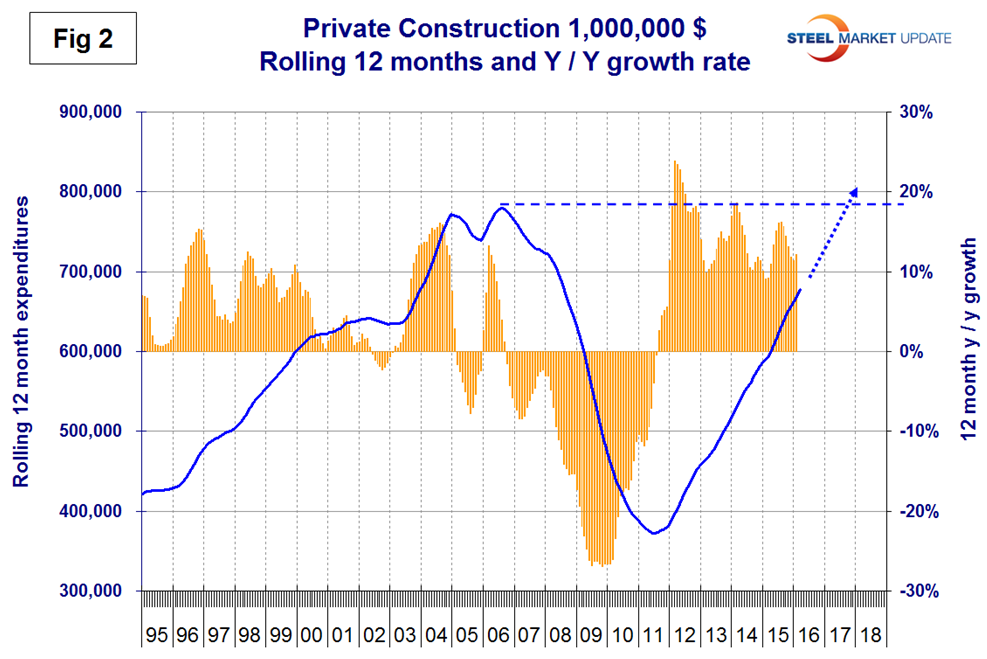
The blue lines in all four graphs in this report are 12 month totals which smooths out seasonal variation. Excluding property improvements our report shows that single family residential has slowed to 11.2 percent, down from 17.3 percent in February last year. Multi-family residential is still surging with a 30.9 percent growth rate in this latest data. The growth of single and multifamily construction expenditures reported here are very different from the starts data as reported by the Census Bureau. (In the starts data the whole project is entered to the data base when ground is broken as described above). Single family starts grew at 23.2 percent in 3 months through March and multifamily contracted by 6.0 percent. Single family starts are growing faster than on going expenditures suggesting positive momentum and the situation for multifamily is the reverse. Private non-residential building expenditures grew at a solid 12.9 percent in three months through March y/y with negative momentum. Within private non-residential, all sectors had positive growth led by hotels/motels and offices however all but three sectors had negative momentum.
State and Local Construction
S&L work expanded by 8.6 percent in the rolling three months through March y/y with positive momentum (Table 3).
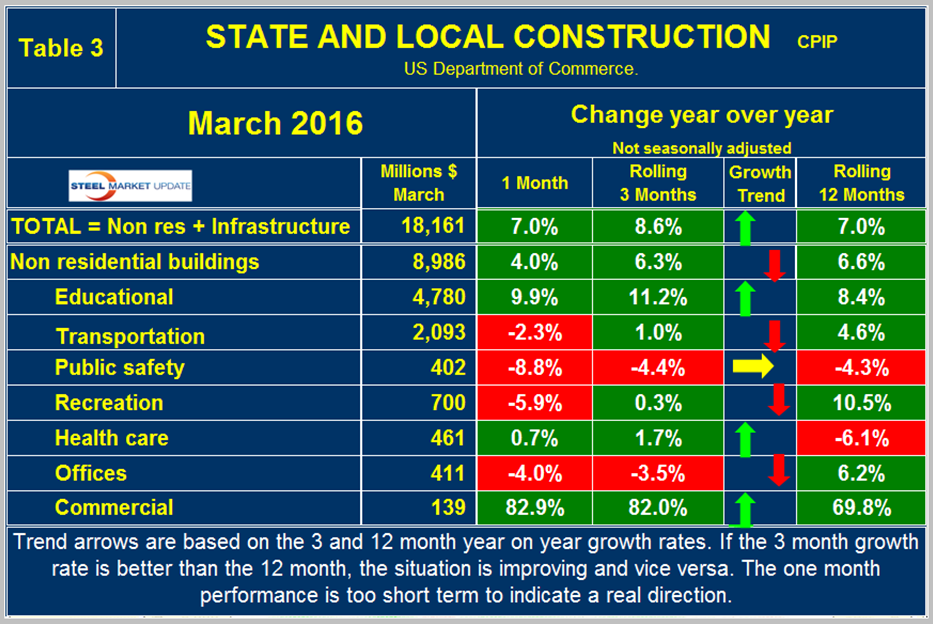
June through October 2015 had the highest growth rates for S&L construction since before the recession but growth slowed in each month of the 4th quarter of 2015 then improved in each month of Q1 2016. Figure 3 shows year over year growth as the brown bars.
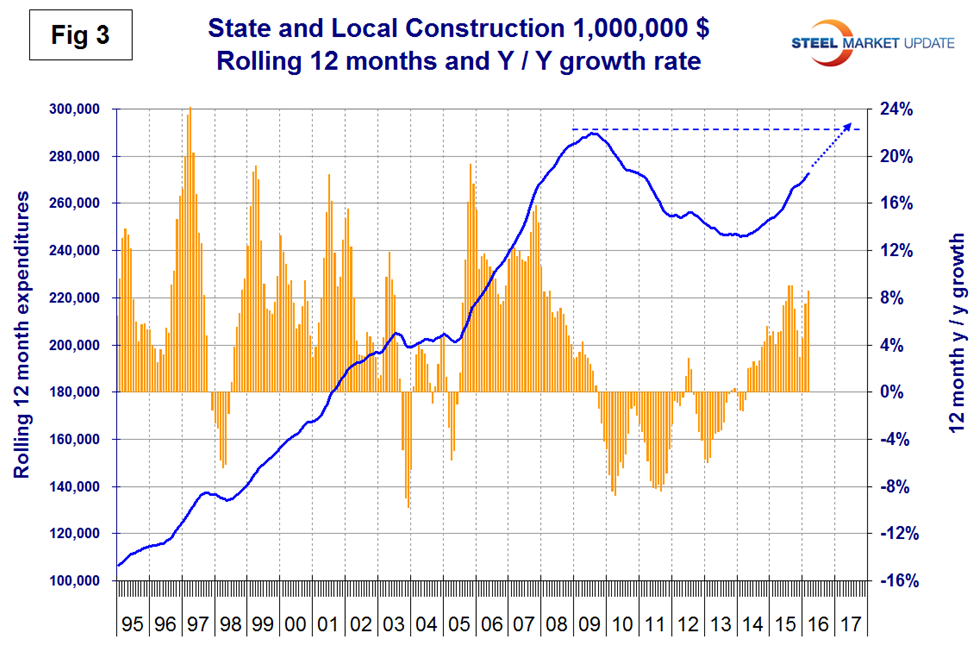
Educational buildings are by far the largest sub sector of S&L non-residential at $4.780 billion in March and on a 3MMA basis y/y grew at 11.2 percent with positive momentum. Transportation terminals slowed to a 1.0 percent growth rate. All other sectors within S&L are relatively small. Recreational buildings which includes convention centers, sports arenas, theaters and miscellaneous amusements grew at 0.3 percent in the latest data with negative momentum. Public safety, which includes jails, police, courthouses and fire stations is in a slump and has contracted for 39 of the last 40 months. Table 2 shows that S&L commercial buildings grew at 82.0 percent but this is a very small volume. Comparing Figures 2 and 3 it can be seen that S&L construction did not have as severe a decline as private work during the recession and that private work bounced back faster. Both the private and S&L expenditures have now recovered to the point that they should exceed the pre-recession peak in 2017.
Drilling down into the private and S&L sectors as presented in Tables 2 and 3 shows which project types should be targeted for steel sales and which should be avoided. There are also regional differences to be considered for which data is not available from the Commerce Department.
Infrastructure
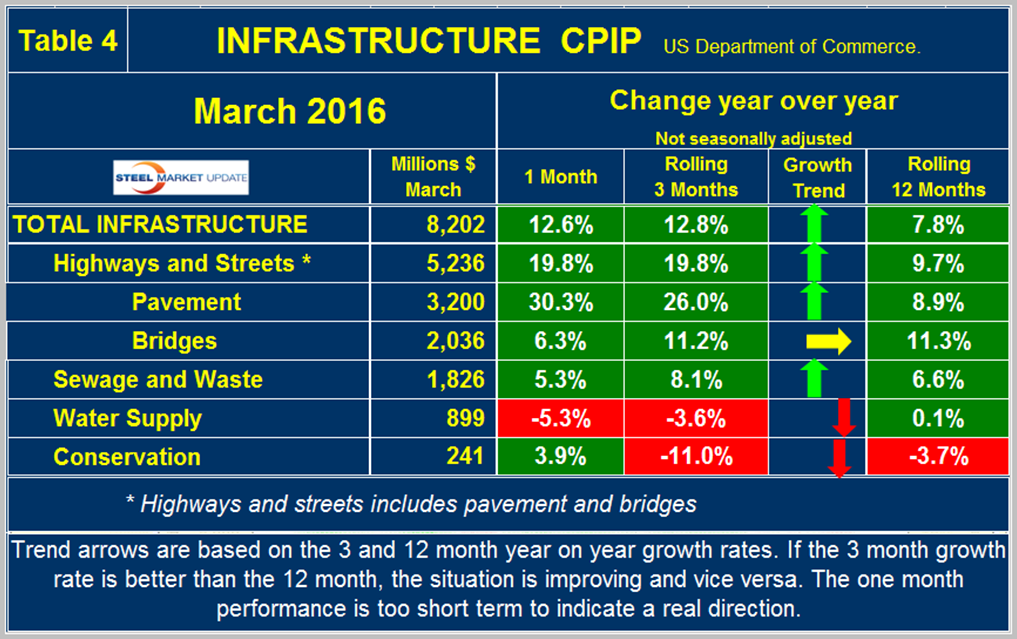
Expenditures have had positive growth every month since July 2013 but growth slowed each month from August through December. In January there was a recovery to 3.3 percent which continued into March when y/y growth was 12.8 percent. Highway and streets including pavement and bridges account for about 2/3 of total infrastructure expenditures and had positive growth every month since April 2015 culminating in a 19.8 percent rate in three months through March. This was the highest growth rate since July 2006. Highway pavement is the main sub-component of highways and streets and had a 26.0 percent positive growth in three months through March. Bridge work has had positive growth for each of the last 16 months. Bridge work exceeded $2.0 billion in the single month of March with an 11.2 percent growth rate (Table 4).
Infrastructure expenditures were slow to respond to the recession due to the magnitude of many of these projects. Growth stopped in 2009 and 2010 but it wasn’t until 2011 that an actual contraction occurred. For most of 2015 through March 2016 infrastructure expenditures exceeded the pre-recession high (Figure 4).
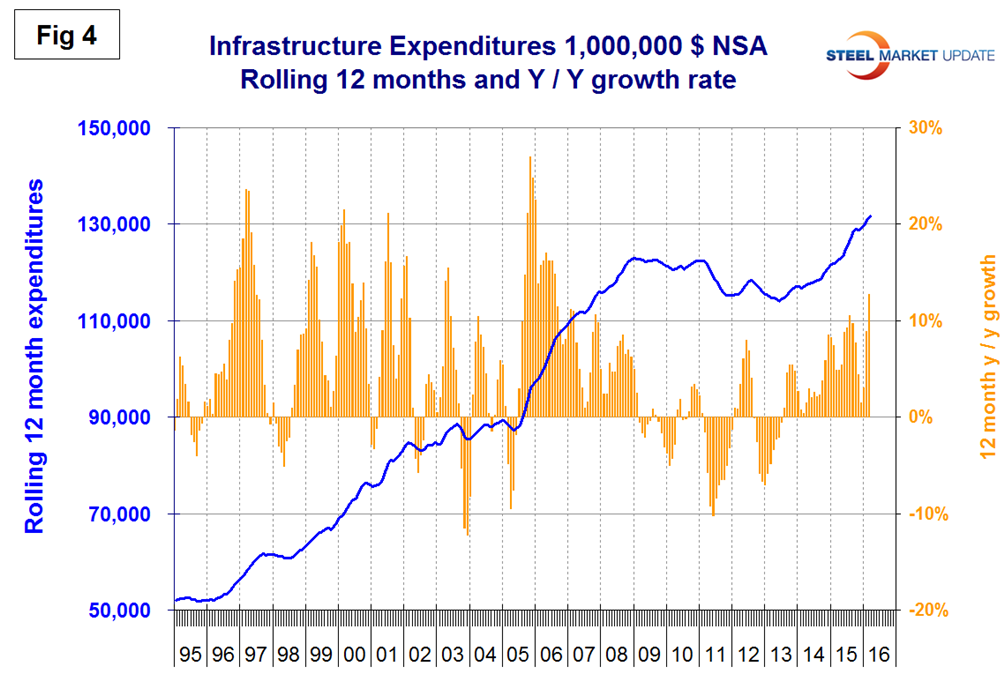
It looks as though the passage in late December of the congressional bill for $305 billion to fund roads, bridges, and rail lines is kicking in. The five-year infrastructure bill is the longest re-authorization of federal transportation programs that Congress has approved in more than a decade, ending an era of stopgap bills and half-measures that left the Highway Trust Fund nearly broke and frustrated local governments and business groups.
Total Building Construction Including Residential
Figure 5 compares YTD expenditures for building construction for 2015 and 2016.
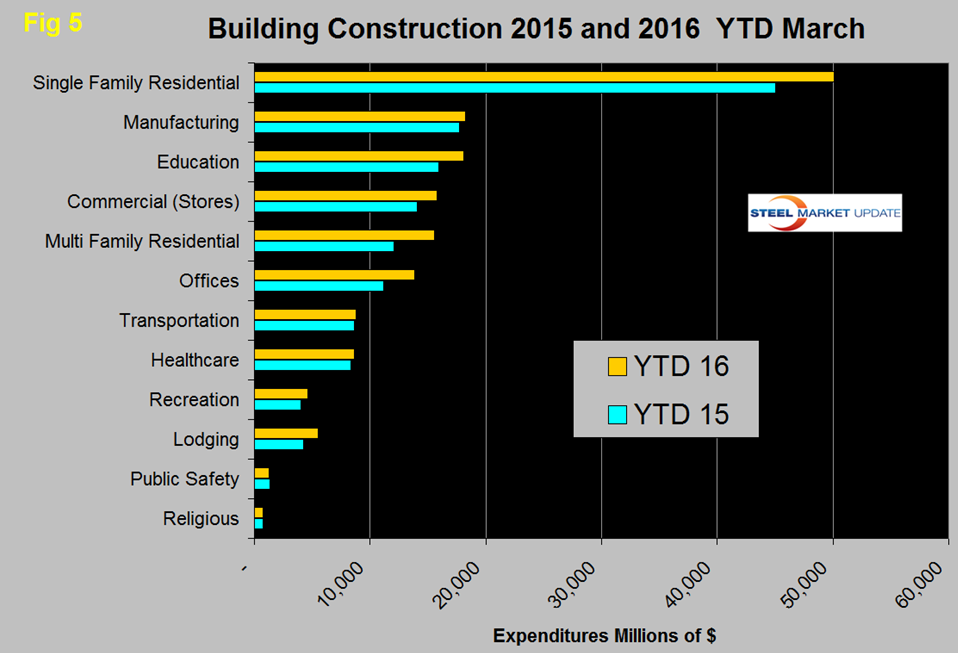
Single family residential is dominant and in March 2016 totaled $18.4 billion. All building sectors except public safety are doing better this year than last. At the other extreme lodging (hotels and motels) were up by 31.6 percent followed by multi-family residential buildings up 29.0 percent and offices up by 23.8 percent.
Explanation: The official CPIP press report gives no appreciation of trends on a historical basis and merely compares the current month with the previous one on a seasonally adjusted basis. The data is provided as both seasonally adjusted and non-adjusted. The detail is hidden in the published tables which we at SMU track and dissect to provide a long term perspective. Our intent is to provide a rout map for those subscribers who are dependent on this industry to “Follow the money.” This is a very broad and complex subject therefore to make this monthly write up more comprehensible we are keeping the information format as consistent as possible. In our opinion the absolute value of the dollar expenditures presented are of little interest. What we are after is the magnitude of growth or contraction of the various sectors. Data is reported by the Commerce Department on both a seasonally adjusted and non-adjusted basis. Their official commentary is based on adjusted numbers. In the SMU analysis we consider only the non-seasonally adjusted data because we don’t trust seasonal adjustments and in any case our businesses operate in a seasonal world. We eliminate seasonal effects by comparing rolling three month expenditures year over year. CPIP data also includes the category of residential improvements which we have removed from our analysis in the rational that such expenditures are minor consumers of steel.
In the four tables above we present the non-seasonally adjusted expenditures for the most recent month of data. Growth rates presented are all year over year and are the rate for the single months result, the rolling 3 months and the rolling 12 months. We ignore the single month year/year result in our write ups because these numbers can contain too much noise. The arrows indicate momentum. If the rolling 3 month growth rate is stronger than the rolling 12 months we define this as positive momentum and vice versa. In the text, when we refer to growth rate we are describing the rolling 3 months year over year rate. In Figures 1 through 4, the blue lines represent the rolling 12 month expenditures and the brown bars represent the rolling 3 month year over year growth rates.


