

Market Data

May 18, 2016
Oil and Gas Prices and Rotary Rig Counts through May 2016
Written by Peter Wright
The following analysis was done by Peter Wright who writes a number of analytical articles for Steel Market Update. The energy markets are key markets for steel so it is important for our readers to understand oil and gas prices as well as the tubular products associated with drilling and transportation of oil and gas.
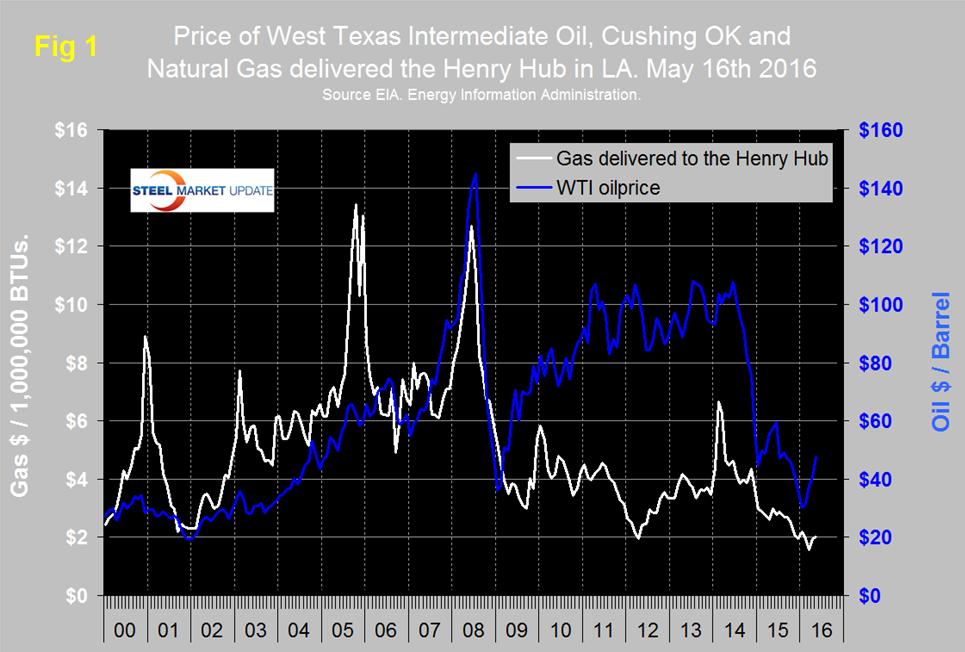
Figure 1 shows historical oil and gas prices since January 2000. The daily spot price of West Texas Intermediate (WTI) closed at $47.72 on May 16th which was the highest since the end of August last year according to the latest daily figure available from the Energy Information Administration (EIA). Brent closed at $48.49 on May 16th.
Wall Street Breakfast, May 9th: Saudi Arabia has replaced Ali al-Naimi, who had been oil minister since 1995, with Khalid al-Falih, chairman of state-owned oil company Aramco. Although many are questioning whether the new oil boss will bring big changes to OPEC’s June meeting, it looks like the Kingdom is sticking to its current strategy. “Saudi Arabia will maintain its stable petroleum policies,” Al-Falih said in a statement. Since 2014, the nation has led OPEC through a new survival-of-the-fittest strategy aimed at defending market share rather than reducing production to support crude prices
On May 11th Gaurav Agnihotri wrote: as both Russia and Saudi Arabia are pursuing the policy of pumping maximum crude oil and grabbing maximum market share, establishing a stronghold in a market like China – the biggest crude oil consumer in Asia, has become vital. As of now, it seems that Russia has won the race. By exporting close to 4.65 million metric tons of crude oil in March 2016, Russia has officially surpassed Saudi Arabia as the biggest supplier of crude oil to China. It is interesting to note that China increased its oil imports from Russia by around 42 percent in first quarter of this year. On the other hand, China’s oil imports from Saudi Arabia increased by merely 7.3 percent in the first quarter of 2016. Does this mean that Saudi Arabia has become the biggest victim of the growing Russia-China partnership? It seems so. Saudi Arabia has already lost is position of being the top crude oil importer to China. With Russia’s Gazprom Neft starting to accept yuan instead of dollars from its Chinese customers, the Saudis are becoming nervous. This is apparent when we look at the recent Saudi Aramco deal with China’s Shandong Chambroad Petrochemical. Instead of selling its crude oil through a typical contract (which is usually one year or longer) at an official selling price (OSP), Aramco sold around 730,000 barrels of crude oil through spot market sale for the very first time. The Saudis have already started making adjustments.
The price of natural gas, delivered the Henry Hub in Louisiana closed at $2.00/MM BTS on May 13th, up from $1.57 on March 4th. May 13th was the latest data published by the EIA. The price has been trending down for two years and it remains to be seen if this recent increase is just a blip. Natural gas is expected to fuel the largest share of electricity generation in 2016 at 33 percent, compared with 32 percent for coal. In 2017, natural gas and coal are both forecast to fuel 32 percent of electricity generation.
Figure 2 shows the apparent supply of the two main steel tubular products used in oil and gas production from January 2003 through March 2016 (apparent supply is a proxy for demand).
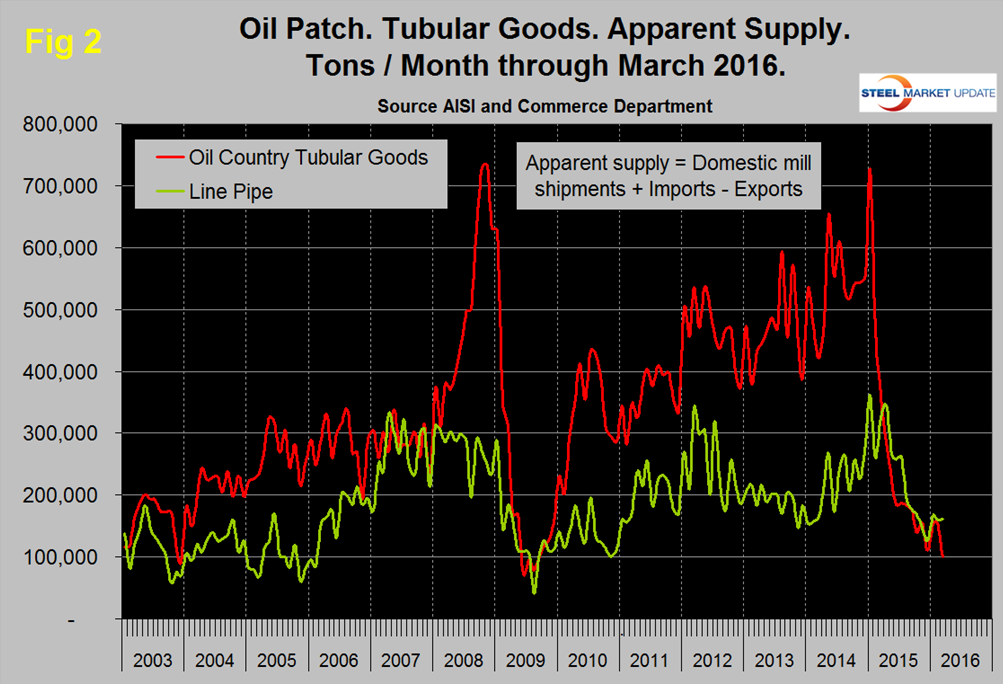
Following a weak December, demand for line pipe was fairly stable in the first quarter but OCTD took another dive in March to its lowest post-recession level. Imports of pipe and tube were down by 53.3 percent year/year in three months through April, which was more than any other product.
The total number of operating rigs in the US and Canada on May 13th was 334, down from 830 at the start of 2016 and down from 2,018 on January 2nd 2015. Year over year the total US and Canada rig count is down by 53.4 percent. Figure 3 shows the Baker Hughes US Rotary Rig Counts for oil and gas equipment in the US through May 13th (explanation below).
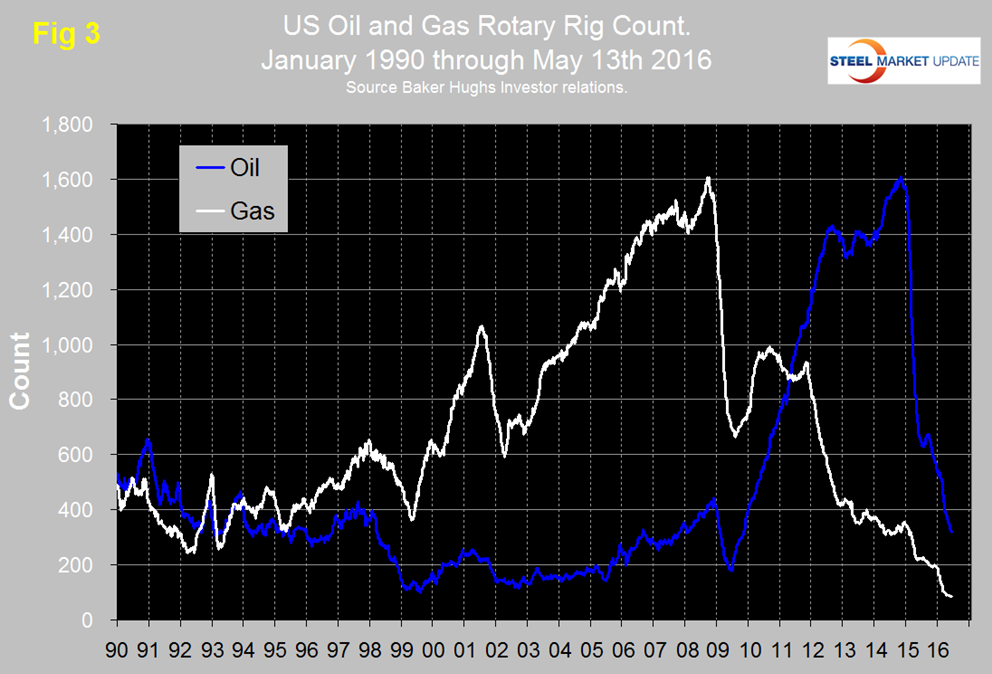
The decline in the US oil rig count hesitated in July and August but since then has been continuous. The count was down by 33 in the last month and this year it has been in free fall. Based on the most recent available data, the EIA estimates that oil production from hydraulically fractured wells now makes up about half of total U.S. crude oil production. U.S. crude oil production averaged an estimated 9.4 million barrels per day (b/d) in 2015, and it is forecast to average 8.7 million b/d in 2016 and 8.2 million b/d in 2017.
The decline in the gas rig count has leveled off with a loss of only one in the last six weeks. However the number of operating rigs at 87 is now lower than at any time since our data began in January 1988.
On a regional basis in the US, the big three states for operating rigs are Texas, Oklahoma and North Dakota. Texas at 180 on May 13th was down from 318 at the beginning of the year, Oklahoma at 56 was down from 87 at the beginning of the year and North Dakota at 24 was down from 53.
About the Baker Hughes Rotary Rig Count
These are a weekly census of the number of drilling rigs actively exploring for or developing oil or natural gas in the United States. Rigs are considered active from the time they break ground until the time they reach their target depth and may be establishing a new well or sidetracking an existing one. The Baker Hughes Rotary Rig count includes only those rigs that are significant consumers of oilfield services and supplies.


