Prices
May 24, 2016
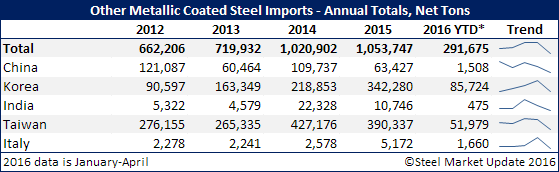
Corrosion Resistant Antidumping/CVD Impact to Date…
Written by John Packard
As we write this article we are aware that the US Department of Commerce will be releasing their “Final Determination” on corrosion resistant steels tomorrow (Wednesday). We will cover their announcement in a special edition of SMU once the announcement is made.
We thought our readers would be interested in seeing both the build-up of imports of galvanized and Galvalume (which are the two main products affected by the corrosion resistant trade suit) and what has happened to coated imports since the suits were filed in early June 2015.
The countries affected by the corrosion resistant AD/CVD suits are: China, Korea, India, Taiwan and Italy.
Galvanized Imports
As you can see by the table below, total galvanized imports into the United States peaked last year at 3,355,515 net tons. During the first four months 2016 the U.S. has imported 922,111 net tons which is a 2.7 million ton pace if the balance of the year remains at the same run rate as the first four months. The expectation (barring any surprise with the Final Determination announcement out of the US DOC) is for galvanized imports to fall off from the pace set during the first four months of this year.
You can clearly see China accelerating GI exports to over 700,000 net tons from the 250,000 ton level seen in 2013. This year Chinese exports of GI have been almost non-existent.
Korea, on the other hand, has been steadily growing their participation in the U.S. market from year to year with 2015 being their largest year of the four shown at 342,439 tons. So far this year the Koreans are on pace to reach 200,000 net tons of GI exports to the USA.
India peaked in 2014 at 419,397 net tons before dropping back in 2015. They are now on pace to export 132,000 net tons of GI to the USA this year.
Taiwan also saw steady growth from 2013 through 2015 peaking at 279,885 net tons. Taiwan is on pace to export approximately 150,000 net tons to the USA this year.
Italy grew to 162,860 net tons during 2015 and are a non-factor at this time. If they continue at the same pace as the first four months 2016 they would reach 39,000 net tons for the year.
Galvalume Imports
Galvalume imports for 2016 appear will be lower than the last two years (875,000 ton trend vs. 1 million tons for both 2014 and 2015). China has become a non-factor as has India and Italy. However, Korea and Taiwan continue to ship Galvalume to the United States.
Korea is on pace to export 260,000 net tons and Taiwan 150,000 net tons. For Korea it would represent the second largest export year for AZ behind 2015. Taiwan, on the other hand, would be at the lowest levels seen over the past five years.