Prices
May 24, 2016
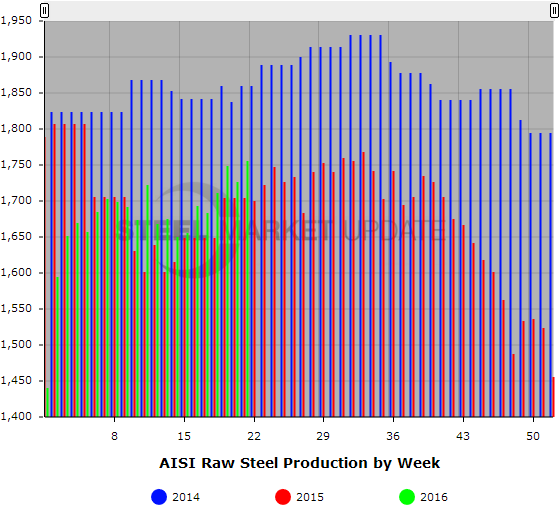
Weekly Raw Steel Production at 9 Month High
Written by Brett Linton
For the week ending May 21, 2016, the American Iron & Steel Institute (AISI) estimated the U.S. steel industry produced 1,756,000 net tons of raw steel, a 1.7 percent increase over the previous week and a 3.1 percent increase over the same week one year ago. The estimated capacity utilization rate is 75.1 percent, up from 73.9 percent last week and up from 72.1 percent this time last year.
The last time raw production was this high was the week ending August 15, 2015 when 1,768,000 tons were produced at a capacity utilization rate of 73.9 percent. The last time the capacity utilization rate was this high was the week ending January 31, 2015 when 1,782,000 tons were produced at a capacity utilization rate of 75.4 percent
Estimated total raw steel produced for 2016 YTD is reported to be 35,240,000 tons, down 1.0 percent from the 35,603,000 tons produced during the same period in 2015. The average capacity utilization rate for 2016 YTD is estimated to be 71.8 percent, up from 71.6 percent for 2015 YTD.
Note that the AISI estimates capability for Q2 2016 to be 30.4 million tons versus 30.7 million tons for the same period last year and 30.4 million tons for the Q1 2016.
Week-over-week changes per district are as follows: Northeast at 209,000 tons, up 11,000 tons. Great Lakes at 656,000 tons, up 43,000 tons. Midwest at 158,000 tons, down 18,000 tons. South at 652,000 tons, up 4,000 tons. West at 81,000 tons, down 11,000 tons. Total production was 1,756,000 tons, up 29,000 tons.
About Weekly Raw Steel Production Data
The weekly raw steel production tonnage provided by the AISI is estimated. The figures are compiled from weekly production tonnage provided by 50 percent of the domestic producers combined with monthly production data for the remainder. Therefore, this report should be used primarily to assess production trends. The monthly AISI production report provides a more detailed summary of steel production based on data supplied by companies representing over 75 percent of U.S. production capacity.
SMU Note: Below is a graphic showing the weekly raw steel production history. To use the graphs interactive capabilities, you must view it on our website. You can do this by clicking here. If you need help navigating the website or need to know your login information, contact us at info@SteelMarketUpdate.com or by calling 800-432-3475.