

Market Data

May 26, 2016
Currency Update for Steel Trading Nations- May 26th 2016
Written by Peter Wright
One of the most important indices a steel buyer (or seller) can follow is that of the value of the U.S. dollar vs. the currency of the key steel trading nations. As the dollar value rises or falls, commodities, including steel, tend to be affected. Currency update articles are normally reserved for our Premium Members but we wanted to share it with our all of our members and the steel industry in general in tonight’s special issue of SMU.
The Broad Index value of the US $ peaked on January 20th at 126.2 and bottomed out on May 2nd at 118.18, a decline of 6.4 percent. On May 20th (latest figure available), the dollar had bounced back by 3.1 percent to 121.87 (Figure 1)
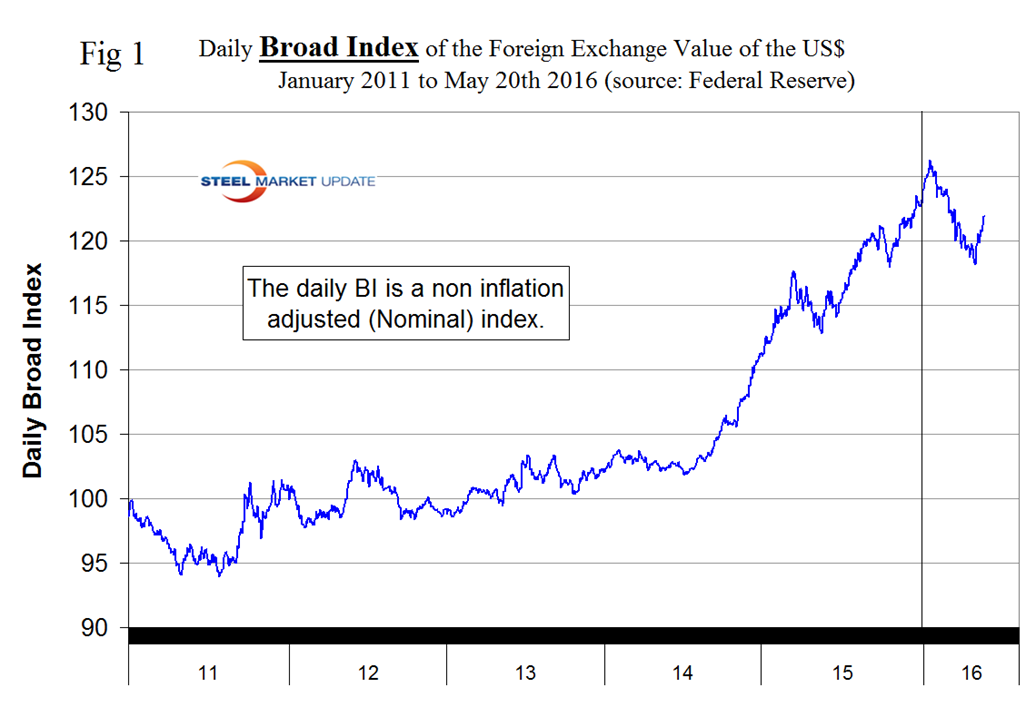
On March 15th the Fed held rates constant and cut its projection for the number of hikes this year from four to two; the dollar continued to plummet.
Sentiment changed on May 2nd and traders swung back into dollar purchases which drove he dollar value up sharply between the 2nd and 20th of this month
On May 19th, Alpha Investments had this to say: As far as we are concerned the only thing that could stop a rate rise by the Fed in its June 14th – 15th meeting is a poor non-farm payrolls reading at the start the month. We expect that this will be the most anticipated non-farm payrolls reading in recent history, with the USD likely to rocket upon a good reading.
On May 23rd Wall Street Breakfast published the following: The U.S. is on the verge of meeting most of the economic conditions the Fed has set to increase interest rates next month, according to FOMC member and Boston Fed President Eric Rosengren. Markets were putting extremely low odds on a summer rate increase until last week, when minutes from the Fed’s April rate-setting meeting suggested it was preparing for the second rate rise since December. Rosengren was one of the Fed doves in 2015, but he has recently become more bullish on the outlook.
Table 1 shows the change in currencies of 16 steel and iron ore trading nations in one year, three months, one month and seven days for each currency and is color coded to indicate strengthening of the dollar in red and weakening in green.
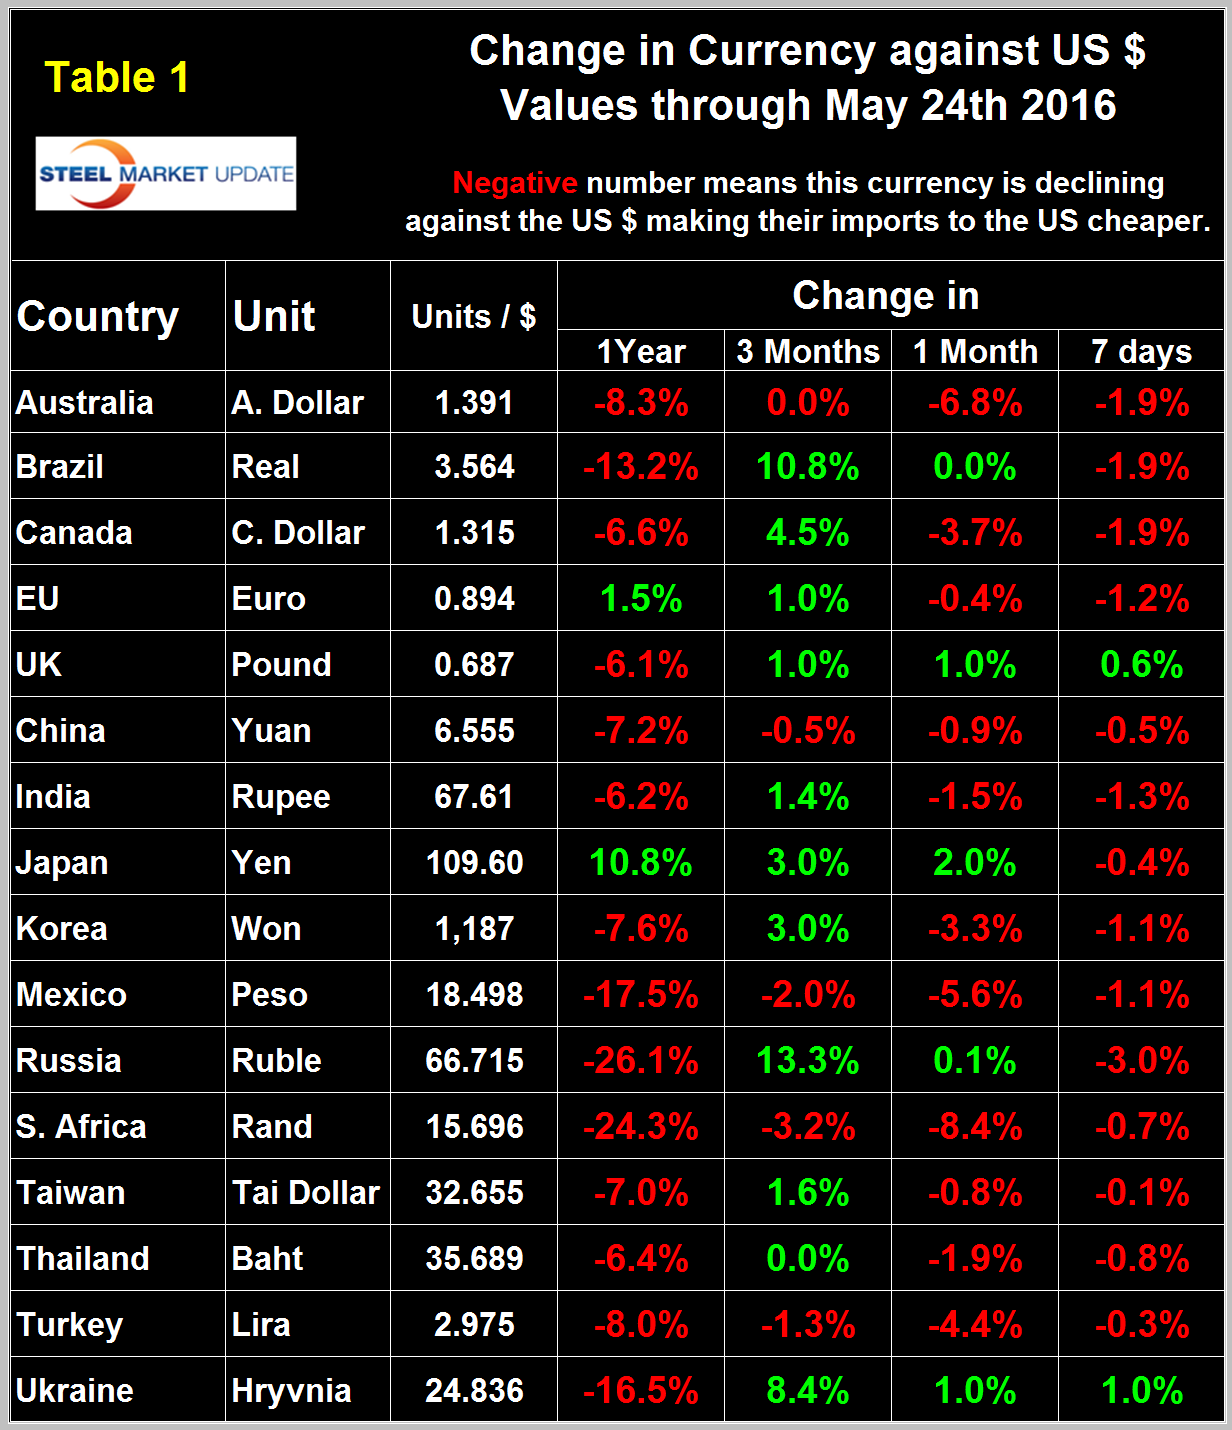
We regard strengthening of the US Dollar as negative and weakening as positive because the effect on net imports. An estimated 25 percent of the U.S. economy had some involvement in international trade therefore currency swings can have a large effects on the economy in general and of the steel industry in particular. The steel trading currencies have been on a rollercoaster this year similar to the broad index in Figure 1. In our January 25th update the dollar strengthened against 15 of the 16 currencies under consideration at the 3 month level as traders increased their dollar positions to obtain a better return on their assets. In our February 21st update the dollar strengthened against 14 of 16 at the 3 month level. In our April 18th update the dollar did a complete reversal and weakened against 14 of the 16 steel and raw materials trading currencies. In this May 24th update at the one month level, the dollar has strengthened against 11 of the 16 currencies under consideration here. Looking at the 7 day level in this latest data the dollar is still strengthening against 14 of the 16 steel trading currencies meaning that the trend is ongoing.
In each of these reports we comment on a few of the 16 steel trading currencies listed in Table 1 and include extracts from sources that we have come across that we deem credible. Charts for each of the 16 currencies listed in Table 1 are available through May 24th for any reader who requests them.
The Euro
On May 24th it took 1.184 US dollars to buy one Euro (Figure 2).
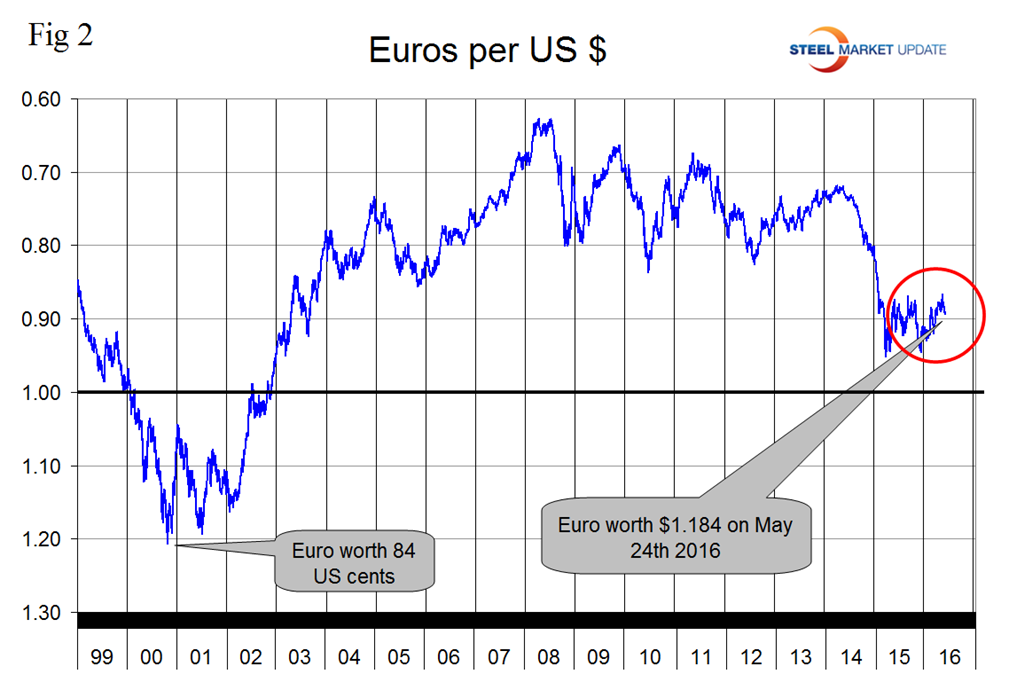
Through that date the Euro had strengthened by 1.0 percent in three months but lost 1.2 percent in the last 7 days. The Euro had a recent low of 1.0580 on November 30th. The euro has been trading in a range for over a year now as traders compare the monetary policy activities of the Fed and the ECB.
May 20th by Kenny Fisher: EUR/USD is steady on Friday, May 20th continuing the lack of movement, which marked the Thursday session. The pair continues to hug the 1.12 line in the European session. On the release front, it’s a quiet end to the trading week. German PPI posted a small gain of 0.1 percent, edging above the forecast of 0.0 percent. Eurozone Current Account impressed, as the surplus surged to EUR 27.3 billion, well above the estimate of EUR 19.6 billion. Over in the US, the sole event on the schedule is Existing Home Sales. The markets are expecting an improvement in the April release, with an estimate of 5.40 million. Will the ECB make any moves in June? The central bank held the course in April and kept the benchmark rate at zero. At the April policy meeting, ECB president Mario Draghi said that he expected interest rates to remain at current levels or lower for an extended period, warning that he would take action to combat the threat of deflation. Although there has been some improvement in growth in the Eurozone, inflation levels remain very low, as underscored by Eurozone Final CPI, which was released on May 18th.
The Japanese Yen
Figure 3 shows the value of the Yen since January 1990.
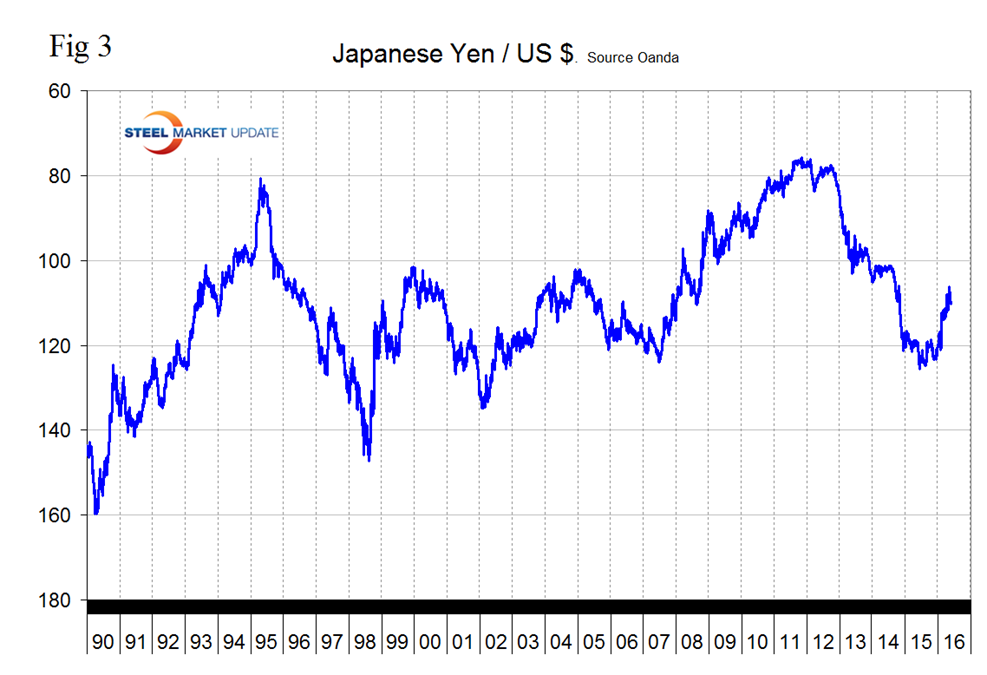
The Yen has strengthened by 3.0 percent in 3 months and 2.0 percent in the last 30 days before declining by 0.4 percent in the last 7 days to close at 109.599/US $ on May 24th.
On May 14th Dean Popplewell wrote: Speculation has risen that the BoJ will adopt further easing in June or July, and USD/JPY has responded with sharp gains on Thursday. With the Japanese economy showing weak growth and the strong yen hurting exports, the BoJ is under strong pressure to adopt further easing measures. The BoJ has warned that it could intervene to curb the climb of the high-flying yen, but analysts say that the BoJ is unlikely to make any such moves until after the G7 meeting later in May, which is being hosted by Japan. Policymakers have tried to “talk down” the yen by warning that Japan will intervene in the currency markets, but this has not done much to push down the yen. Meanwhile, there was positive news as Japan’s current account surplus widened to 1.89 JPY trillion in March, just shy of the estimate of JPY 1.90 trillion. This was the highest surplus recorded since last March.
From Wall Street Breakfast, May 23rd: Japanese manufacturing activity contracted at the fastest pace in more than three years in May as new orders slumped, putting fresh pressure on the country to unveil additional stimulus. The Markit/Nikkei Flash Manufacturing PMI fell to 47.6 on a seasonally adjusted basis, from a final 48.2 the month before. The data was accompanied by trade figures for April. Japanese exports declined 10.1 percent on-year, while imports tanked by an annual 23 percent, leaving the nation with a trade surplus of ¥823B ($7.5B).
The Japanese government’s patience may have come to an end and they are about to enter into an all-out global currency war, as Finance Minister Taro Aso threatened to intervene in foreign exchange markets and said that the Japanese government would not tolerate a persistent “one-sided” rise in the yen. He warned that the government was “determined to stop it”, according to the Australian Financial Review. Despite the U.S. warning to Japan against competitive currency devaluation, the yen continues to weaken even after the Cabinet Office of Japan said on Tuesday that Japan’s GDP came in at 1.7 percent in the first-quarter of 2016, following an annualized 1.1 percent contraction in the fourth-quarter 2015. The USD/JPY currency pair is now threatening to break above the 110 psychological level and is heading to test the 110.58, or 50.0 percent Fibonacci retracement level. Direct intervention by Japan to stem the yen’s rise against the U.S. dollar would ignite a global currency war and risk a backlash from the U.S.
The Chinese Yuan
Figure 4 shows the history of the Yuan against the US $ since January 2002.
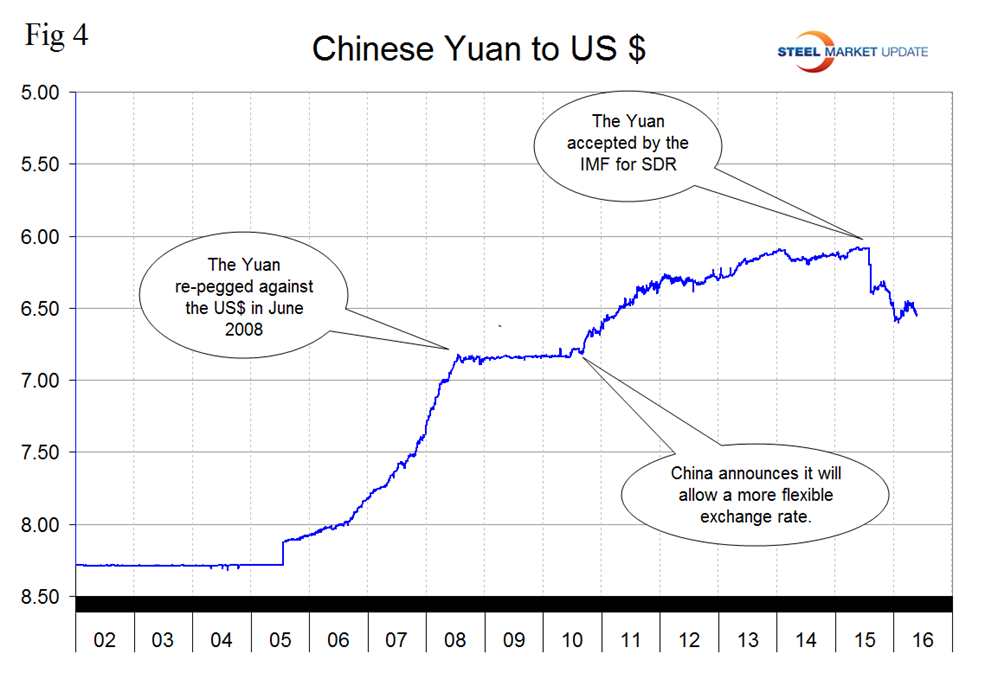
In the last 30 days the Yuan has weakened by 0.9 percent. Following the devaluation in August the Yuan bottomed out at 6.4028 on August 27th. Then it recovered to 6.3185 on October 31st bottomed out again on January 9th at 6.5907, recovered to 6.448 on March 31st then declined again to 6.5546 on May 24th.
From Seeking Alpha May 25th: The People’s Bank of China lowered the yuan’s reference rate by 0.3 percent to 6.5693 per dollar overnight. The moves could increase tensions between China and its trading partners, as recent strength in the dollar and yen make exports from those countries less competitive globally. “It could be because the authorities want to alleviate some of the depreciation pressure before the Fed interest rate decision in June,” said Christy Tan, head of markets strategy at National Australia Bank Ltd. in Hong Kong.
The Canadian Dollar
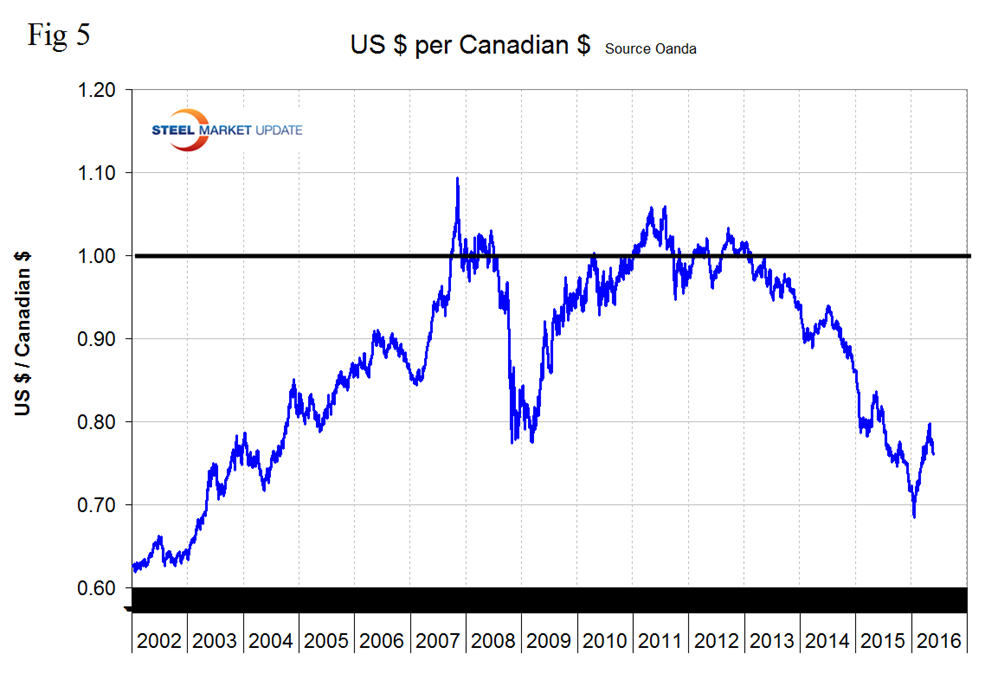
Figure 5 shows the value of the C$ since January 2002. In the three months before May 24th the C$ appreciated by 4.5 percent but has lost 3.7 percent in the last 30 days. The C$ is now worth 76.06 US cents
The Mexican Peso
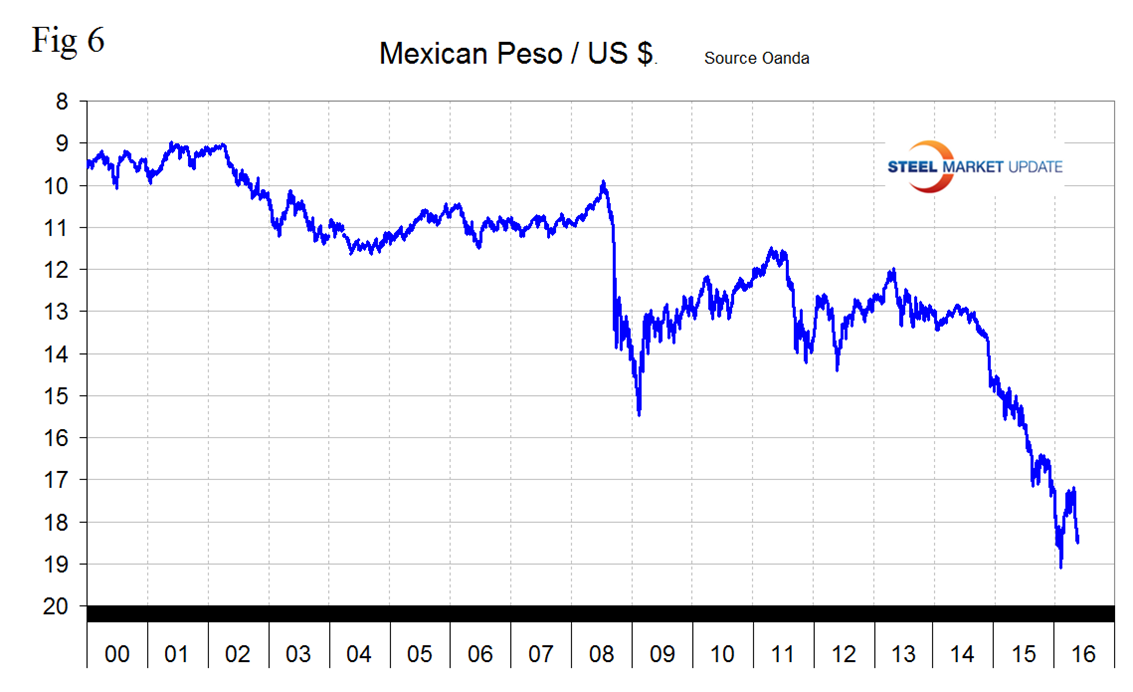
Figure 6 shows the value of the Peso since January 2000. In the 30 days before May 24th the Peso lost 5.6 percent and it now takes 18.5 Pesos to buy a US $.
The Russian Ruble
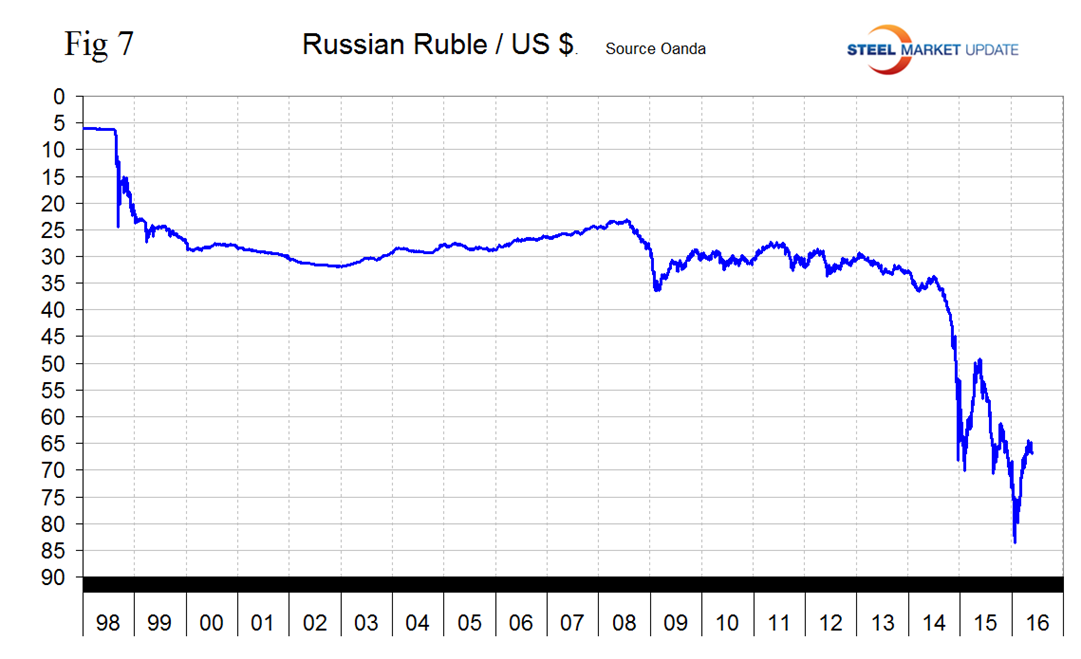
Figure 7 shows the value of the Russian Ruble since January 1998. In the three months before May 24th the Ruble appreciated by 13.3 percent but lost 3.0 percent in the last 7 days.
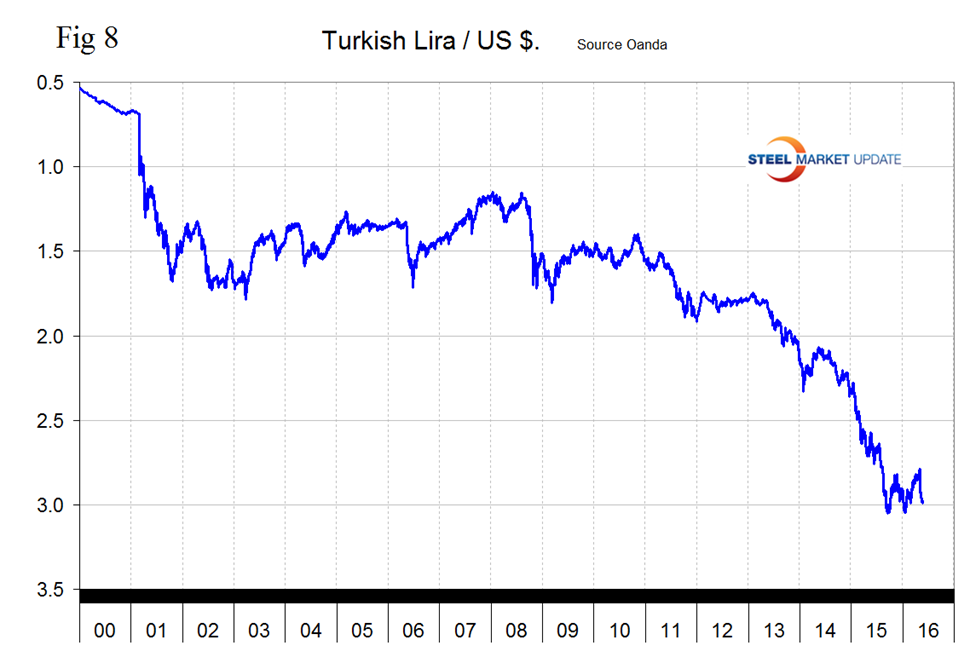
The Turkish Lira
Figure 8 shows the value of the Lira since January 2000. The Lira has lost 4.4 percent in the last 30 days, is close to falling below three to the dollar and is flirting with its all-time low of 3.052 of September 15th last year.
Explanation of Data Sources: The broad index is published by the Federal Reserve on both a daily and monthly basis. It is a weighted average of the foreign exchange values of the U.S. dollar against the currencies of a large group of major U.S. trading partners. The index weights, which change over time, are derived from U.S. export shares and from U.S. and foreign import shares. The data are noon buying rates in New York for cable transfers payable in the listed currencies. At SMU we use the historical exchange rates published in the Oanda Forex trading platform to track the currency value of the US $ against that of sixteen steel trading nations. Oanda operates within the guidelines of six major regulatory authorities around the world and provides access to over 70 currency pairs. Approximately $4 trillion US $ are traded every day on foreign exchange markets.


