Market Data

June 5, 2016
SMU Survey Respondents on More Price Increases/Demand
Written by John Packard
Last week Steel Market Update conducted our early June flat rolled steel market trends analysis. Besides gathering data regarding how buyers and sellers of flat rolled steel feel about their company’s ability to be successful (SMU Steel Buyers Sentiment Index) we also asked questions about pricing, demand, buying patterns, foreign steel, lead times and negotiations. We posted the results on Friday for our Premium level members and those who participated in the survey.
Over the past few surveys we have been asking our respondents if they expect the domestic steel mills to raise prices within the next 30 days. We found the results from last week quite interesting as many buyers and sellers of steel are beginning to think that the pace of mill increases may be waning.
At the beginning of May 2016 only 5 percent of those surveyed did not believe the mills would raise prices within 30 days. That number increased to 17 percent by Mid-May and now stands at 38 percent.
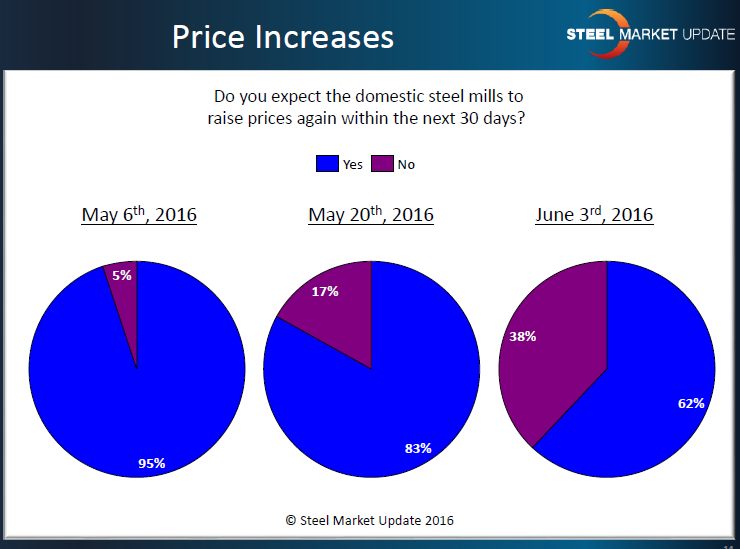
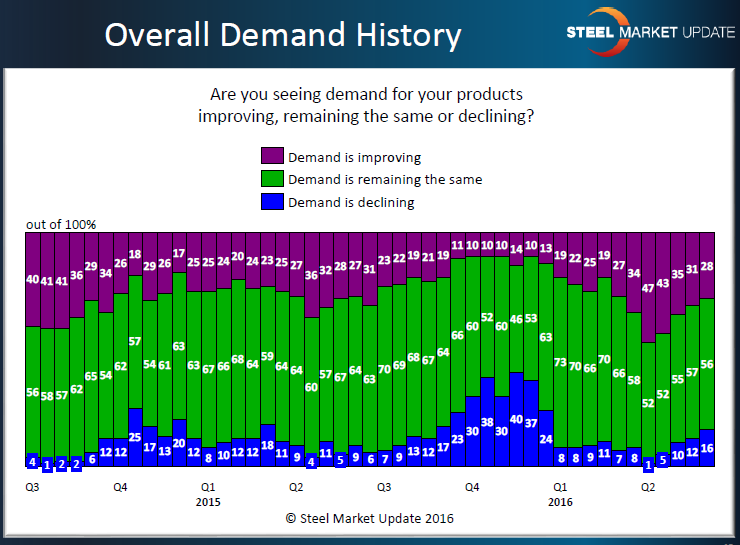
We do not assume that this is the end of the price announcements (as 62 percent believe there will be more). However, we are concerned about another piece of data gleaned from last week’s analysis and that is a weakening trend seen in overall demand (all respondents).
During the 1st Quarter we saw our respondents as much more bullish on whether demand for their products was improving (the purple bars in the graphic below), remaining the same or in decline. As you can see those reporting demand as improving has dropped from a high of 47 percent at the beginning of April to 28 percent. We are now at levels similar to what we saw last year at this time and we will have to wait and see if we transition into a similar track taken in 3Q 2015 as those reporting demand spiked in early 4th Quarter.