

Prices

June 8, 2016
Flat, Long, and Semi-Finished Imports through May 2016
Written by Peter Wright
Licensed data for May was reported by the Steel Import Monitoring System of the US Commerce Department on June 3rd. An explanation of the methodology that we at SMU use to analyze the trade data is given at the end of this piece.
![]() Total rolled product licensed imports in the single month of May were 1,956,816 short tons with a three month moving average (3MMA) of 1,966,266 tons. The May volume was almost exactly the same as the final March and April tonnages. We prefer not to dwell on single months results because of the extreme variability that can occur in individual products. In the comments below we use only three month moving averages to get a more representative picture.
Total rolled product licensed imports in the single month of May were 1,956,816 short tons with a three month moving average (3MMA) of 1,966,266 tons. The May volume was almost exactly the same as the final March and April tonnages. We prefer not to dwell on single months results because of the extreme variability that can occur in individual products. In the comments below we use only three month moving averages to get a more representative picture.
Figure 1 shows the 3MMA through May licenses for semi-finished, flat and long products since January 2004.
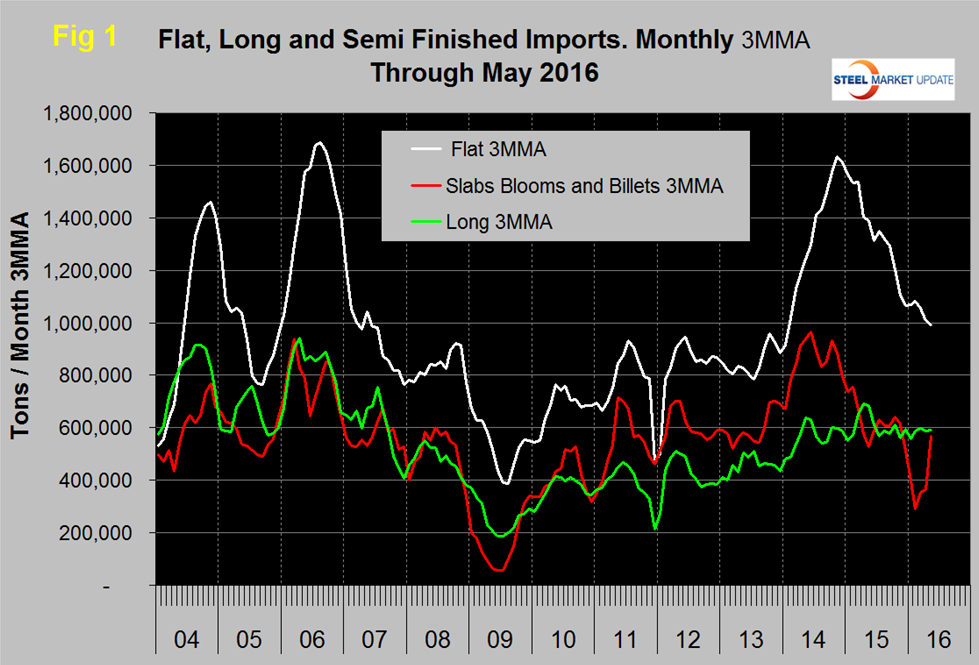
Imports of semi-finished in May were 787,055 tons with a three month moving average of 569,069 tons. The May semi-finished volume was down by 9.7 percent from the average of the first six months of 2015. February this year had a very low volume of semis as shown by the red line in Figure 1. “Flat” includes all hot and cold rolled sheet and strip plus all coated sheet products plus both discrete and coiled plate. The 3MMA of flat rolled imports peaked at 1,634,000 tons in November 2014 and has steadily fallen to 990,628 tons in May which was the first month below a million tons since January 2014. Long product imports have been range bound between 519,000 tons and 772,000 tons since March 2014 with no particular trend evident. In May the 3MMA of long product imports was 592,224 tons.
Figure 2 shows the trend of sheet and strip products since January 2004.
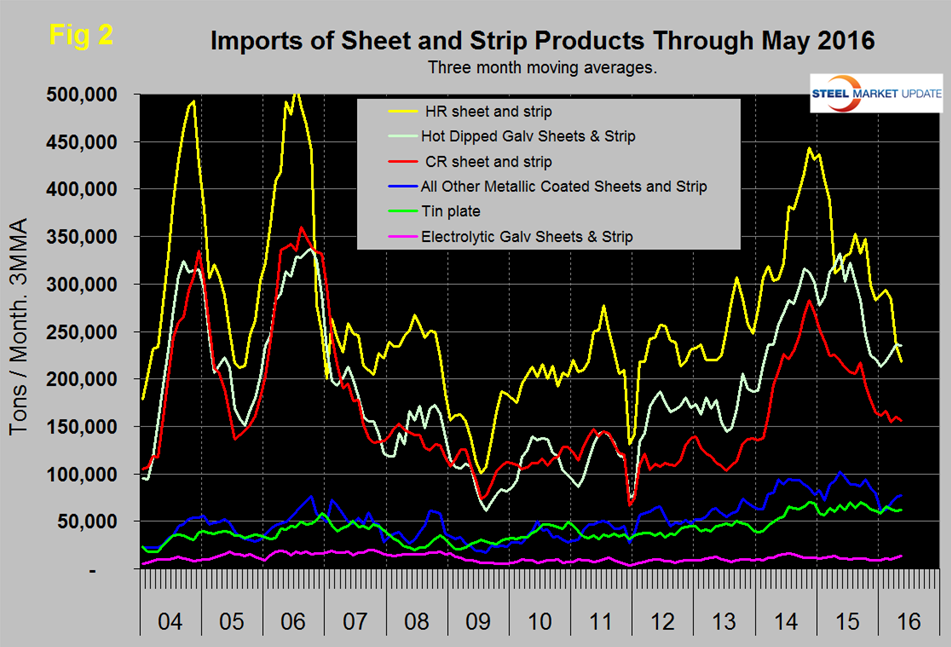
Hot rolled continued its rapid decline in May as the decline of cold rolled slowed. HDG and other metallic coated (mainly galvalume) have increased this year though both are below the volumes this time last year. Tin plate and electro galvanized were little changed in May.
Table 1 provides an analysis of major product groups and of sheet products in detail. It compares the average monthly tonnage in the latest three months through May with both three months through February (3M/3M) and three months through May 2015 (Y/Y).
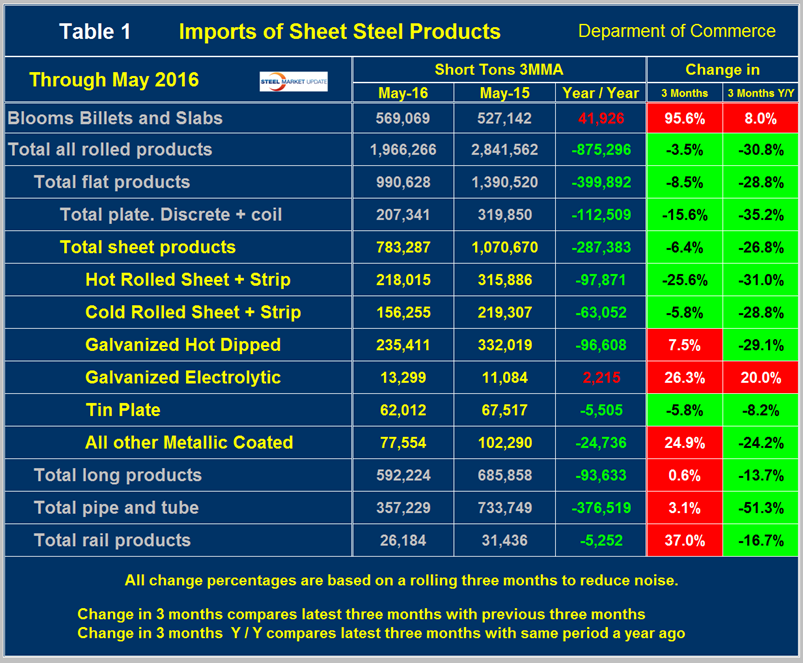
On a Y/Y basis the total of all rolled products was down by 875,000 tons or 30.8 percent, as total sheet products were down by 26.8 percent. Tubulars were down by 51.3 percent. Semi-finished slabs, blooms and billets were down by 8.0 percent and long products were down by 13.7 percent. Electro galvanized was the only sheet product to have a Y/Y increase. There was an increase in many categories on a 3M/3M basis as indicated by the color code red. The extremely large 3M/3M increase in semis was a result of the very low February volume. The total volume of hot worked products was down by 3.5 percent 3M/3M. Hot rolled and cold rolled were down but all galvanized products increased. These trends indicate that in the big picture and with the exception of long products the overall volume of imports is down significantly though overall the decline is slowing. The color codes in Tables 1 and 2 for the three month and year over year change show which products are improving and which have still experienced import volume increases in these two time frames.
Table 2 shows the same analysis for long products.
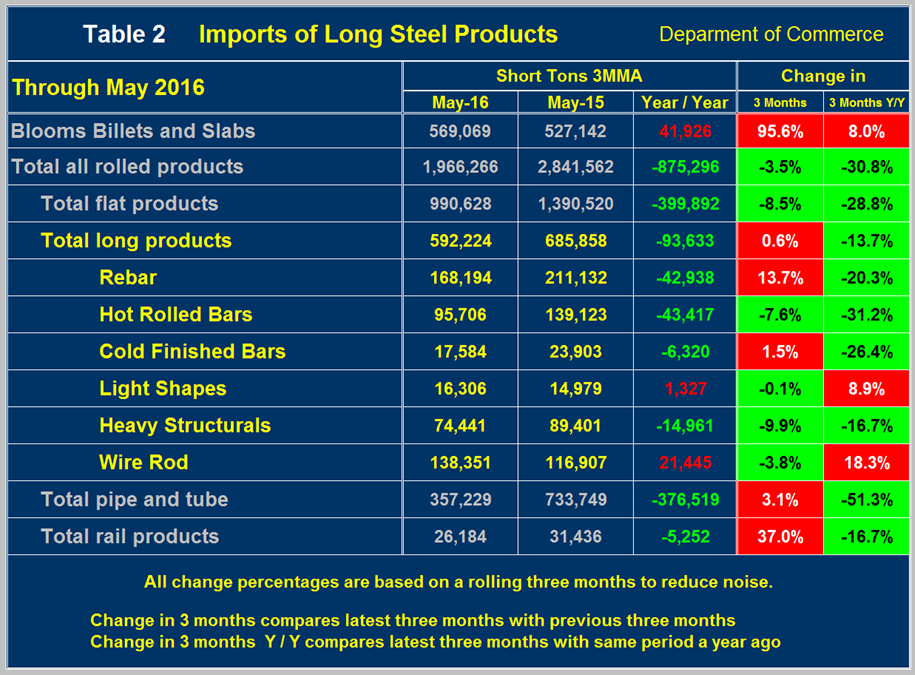
The total tonnage of long products was down by almost 94,000 tons per month Y/Y. Wire rod and light shapes were the only product to have a volume increase on this basis. On a 3M/3M basis the total volume of long products increased by 0.6 percent led by rebar that was up by 13.7 percent.
Figure 3 shows the import market share of sheet and long products through April which is the latest data available for total steel supply.
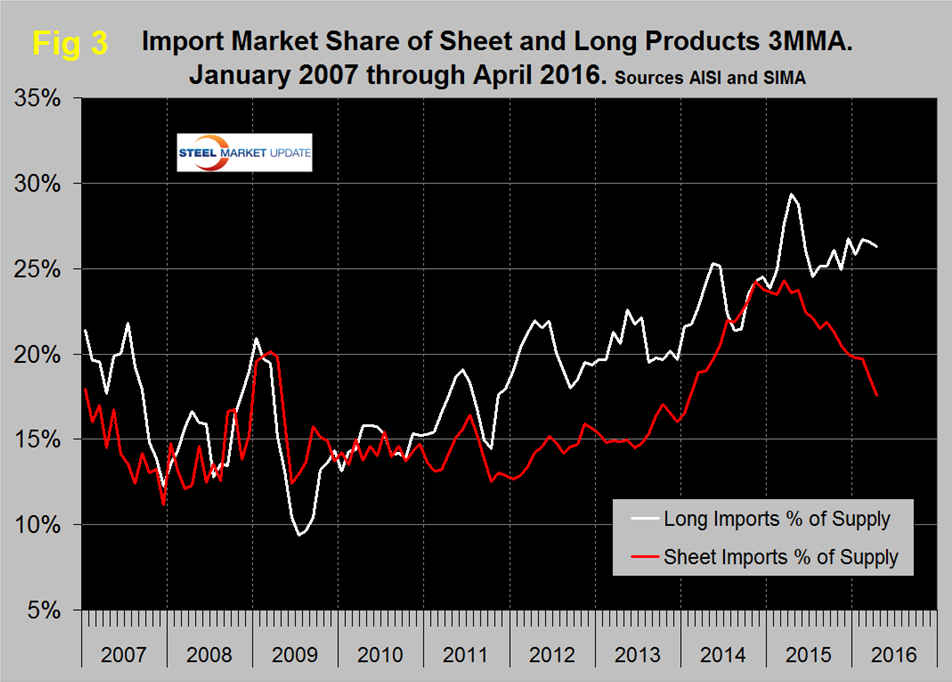
The import market share of sheet products peaked at 24.3 percent in March 2015 and has been < 20 percent for each month of 2016. In April this declined to 17.9 percent. Long product import market share peaked at 29.4 in May 2015 but has only had two months since then below 25 percent. Import share in April was 26.3 percent. Figure 4 and Figure 5 show supply and imports for sheet and long products respectively on double axis graphs.
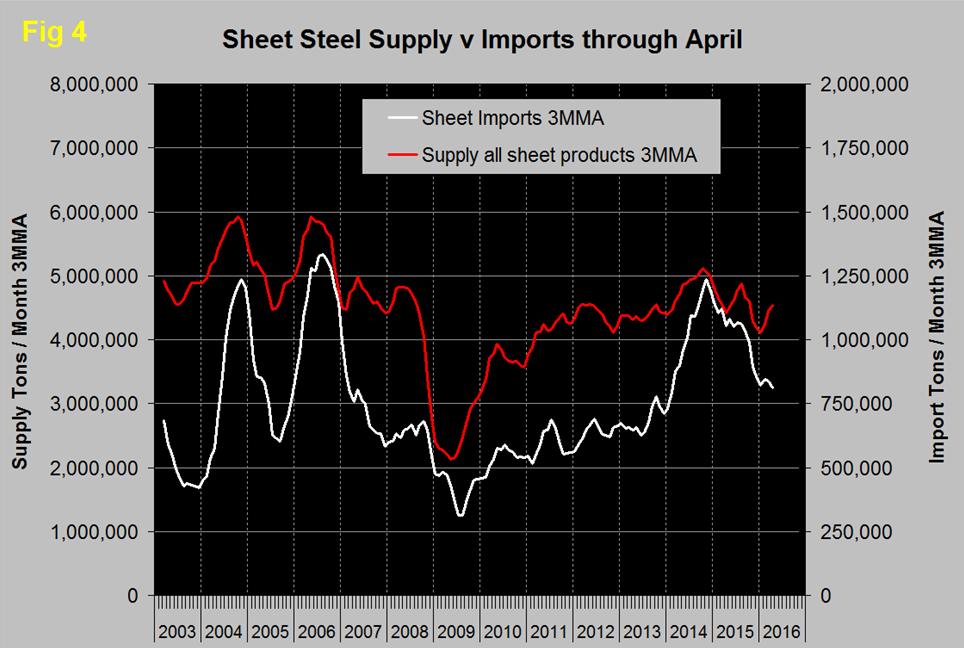
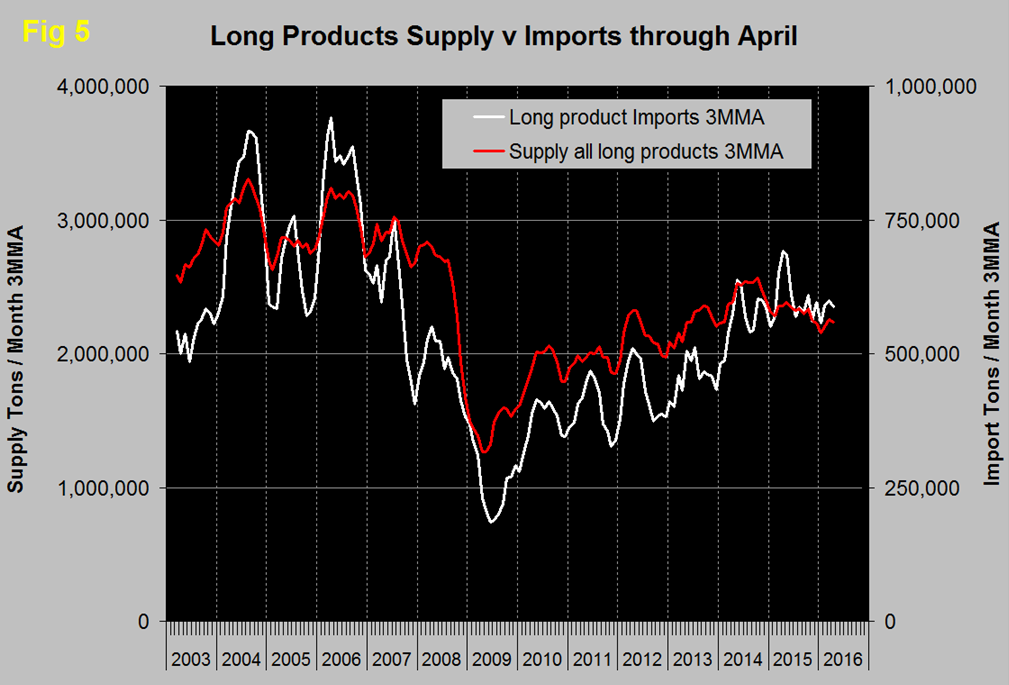
Note that the scales are proportional and start at zero in all cases so there is no data manipulation. Our point is to expand on the theme that the situation of sheet and long products is completely different. The import surges of 2004 and 2006 were clearly driven by demand for both product groups. The late 2014 surge in sheet product imports was not driven by a proportional increase in domestic demand and have dropped off much faster than the demand decline. We interpret this to be a manifestation of global over supply followed by buyer caution as trade case activity increased. In the case of long products, imports and demand have had an 89.9 percent correlation since January 2009. This indicates that almost all of the changes in import volume can be explained by factors in the domestic market and that import market share in the immediate future will not follow the lead of sheet products.
Net imports equals imports minus exports and our analysis is based on the final volumes through April. We regard this as an important look at the overall trade picture and its effect on demand at the mill level. Figure 6 shows that net sheet product imports on a 3MMA basis at 445,092 tons in April were down by 237,000 tons year over year and down by over a million tons YTD.
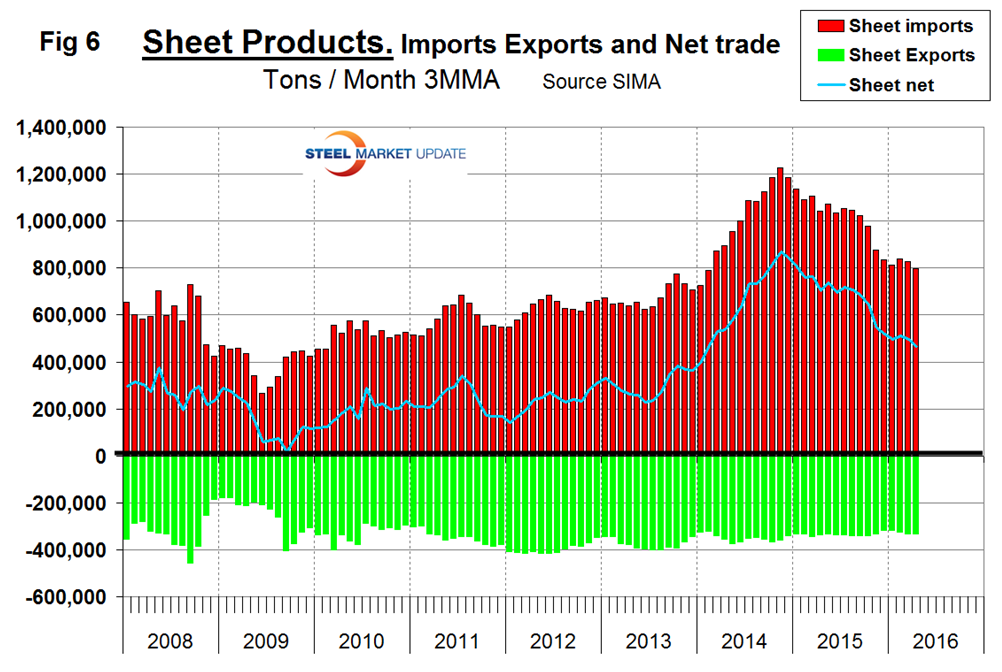
Compared to imports, exports have been relatively consistent for almost eight years. Net sheet steel imports are still strong by historical standards. The decline in the value of the US$ that has occurred this year will have a down-ward influence on this aspect of total steel trade.
Explanation: The SMU publishes several import reports ranging from this very early look using licensed data to the very detailed analysis of final volumes by product, by district of entry and by source nation which is available on the premium member section of our web site. The early look, the latest of which you are reading now has been based on three month moving averages (3MMA) using the latest licensed data, either the preliminary or final data for the previous month and final data for earlier months. We recognize that the license data is subject to revisions but believe that by combining it with earlier months in this way gives a reasonably accurate assessment of volume trends by product as early as possible. We are more interested in direction than we are in absolute volumes at this stage. The main issue with the license data is that the month in which the tonnage arrives is often not the same month in which the license was recorded. In 2014 as a whole our data showed that the reported licensed tonnage of all carbon and low alloy products was 2.3 percent less than actually receipts, close enough we believe to confidently include licensed data in this current update. The discrepancy declined continuously during the course of the twelve month evaluation as a longer time period was considered.


