

Market Data

June 15, 2016
Producer Price Indexes of Sheet Steel, Aluminum, Plastic and Transportation
Written by Peter Wright
On Wednesday this week the Bureau of Labor Statistics (BLS) released its series of Producer Price Indexes (PPI) for more than 10,000 goods and materials. For an explanation of this program see the end of this piece. The latest release this week reported results through May. We run this analysis every three or four months to give readers an opportunity to become aware of any changes in the competitive position of steel against other materials and rail vs truck transportation. The PPI data are helpful in monitoring the price direction of steel and steel products against competing materials and products. As far as we at SMU can tell from comparison with known transaction prices, these PPI are a reasonable representation of the real world though there may be a lag between what the BLS reports and spot prices for steel products. We have also concluded that the actual index values of the PPIs of different products cannot be compared with one another because they are developed by different committees within the BLS. We believe that this data is useful in comparing the direction of prices in the short and medium term but not the absolute value.
The May report from the BLS read as follows: The Producer Price Index for final demand increased 0.4 percent in May, seasonally adjusted. Final demand prices rose 0.2 percent in April and declined 0.1 percent in March. On an unadjusted basis, the final demand index inched down 0.1 percent for the 12 months ended in May. In May, over 60 percent of the advance in the final demand index can be traced to prices for final demand goods, which climbed 0.7 percent. The index for final demand services moved up 0.2 percent. Prices for final demand less foods, energy, and trade services edged down 0.1 percent in May after rising 0.3 percent in April. For the 12 months ended in May, the index for final demand less foods, energy, and trade services increased 0.8 percent.
For the purpose of this report, we at SMU have extracted comparative statistics for sheet steel, aluminum and plastic products and truck and rail transportation. Table 1 is a summary of each category on a year over one, two and three year basis.
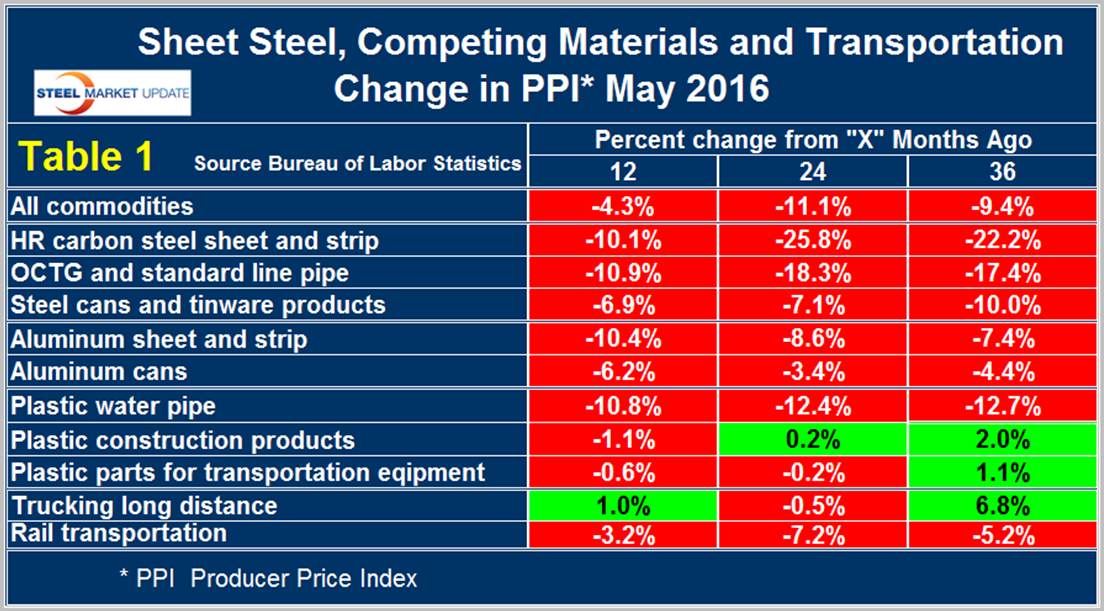
The gain/loss pattern as shown by the color codes in this latest update is very similar to our February analysis except that plastic parts and long distance trucking contracted at the 24 month level after previously having been positive. The price index for hot rolled sheet and strip shows a y/y contraction of 10.1 percent which is why we conclude that these indexes are somewhat delayed. Having said that, we believe that comparisons with competing materials are valid. Our analysis of the PPI data shows that commodity prices as a whole declined by 4.3 percent in 12 months May, and improvement from the 5.0 percent decline in 12 months through February. Commodity prices in general are back to where they were in mid-2010. A rising $ will put downward pressure on commodity prices. It is evident from Table 1 that carbon steel sheet declined much more than aluminum sheet at the 24 and 36 month levels but that in the latest data the two products synchronized. The same pattern has existed for steel and aluminum cans and for steel and plastic piping. In all instances steel declined the most in 24 and 36 months but in the last year comparative declines have become very similar. Steel dominates in most oil production and refining applications as plastic is used more often in distribution, mostly of natural gas, to end users. An analyst with Cleveland based Freedom Group Inc., told AMM that plastic made significant inroads in oil and gas pipe applications in 2009 through 2012 but since then inroads have slowed.
The prices of plastic construction products and plastic parts for transportation equipment have declined very little in the last 12 months in spite of the collapse in hydrocarbon prices.
Table 1 also shows price changes for truck and rail transportation and indicates that rail has become more competitive in all three time periods considered.
The official description from the Bureau of Labor Statistics (BLS) reads as follows: The Producer Price Index (PPI) is a family of indexes that measure the average change over time in the prices received by domestic producers of goods and services. PPIs measure price change from the perspective of the seller. This contrasts with other measures, such as the Consumer Price Index (CPI). CPIs measure price change from the purchaser’s perspective. Sellers’ and purchasers’ prices can differ due to government subsidies, sales and excise taxes, and distribution costs. More than 10,000 PPIs for individual products and groups of products are released each month. PPIs are available for the products of virtually every industry in the mining and manufacturing sectors of the U.S. economy. New PPIs are gradually being introduced for the products of industries in the construction, trade, finance, and services sectors of the economy. More than 100,000 price quotations per month are organized into three sets of PPIs: (1) Stage-of-processing indexes (2) commodity indexes, and (3) indexes for the net output of industries and their products. The stage-of processing structure organizes products by class of buyer and degree of fabrication. The commodity structure organizes products by similarity of end use or material composition. The entire output of various industries is sampled to derive price indexes for the net output of industries and their products.


