

Market Data
July 7, 2016
SMU Steel Sentiment Index Continues on Its Optimistic Track
Written by John Packard
Since 2008, Steel Market Update has been measuring how steel buyers and sellers feel about their company’s ability to be successful in the existing market environment (which we call “Current Sentiment”). We also probe the same group of manufacturers, steel service centers, steel mills, trading companies and toll processors on how they feel about their company’s ability to be successful three to six months into the future (“Future Sentiment”). Our analysis is done twice per month and we have just completed our analysis of the responses received since Tuesday of this week. An explanation of the Index values are explained at the end of this article.
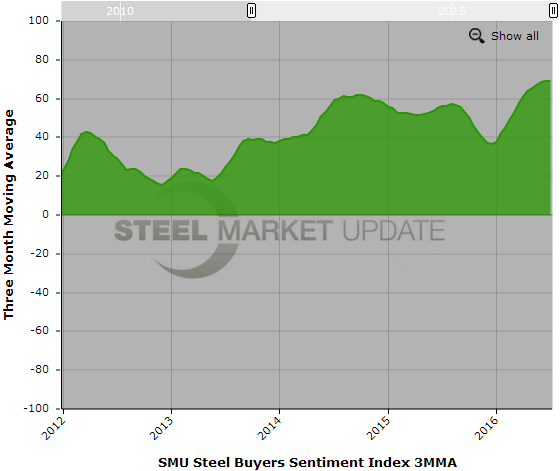
The single data point for Current Sentiment came in at +71 matching the record high for the index first achieved in mid-April 2016. However, we prefer to look at the data based on the three month moving average (3MMA). The three month moving average set a new record high of +69.17 surpassing the last high achieved in our last survey (+69.0). One year ago our 3MMA was +56.0.
Future Sentiment Index
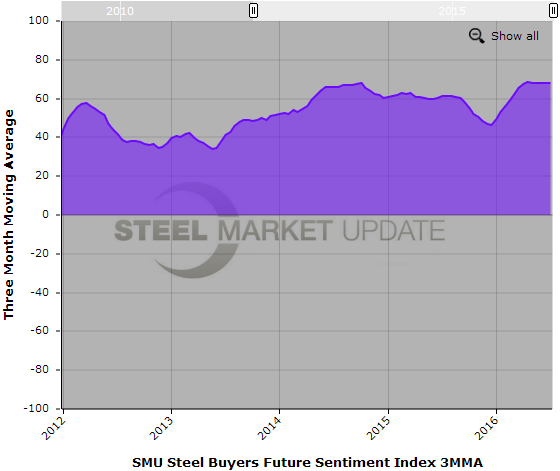
Future Sentiment dropped two points from our last survey and is being reported as being +69. The +69 is the same as one month ago and +5 points higher than one year ago.
When looking at Future Sentiment based on a three month moving average (3MMA) we saw our Index decline slightly to +67.83 from the +68.17 reported during the middle of June. One year ago Future Sentiment 3MMA was +61.50.
What Our Respondents Are Saying
“Business is winding into the summer doldrums.” Service center
“Business conditions as they exist today are horrid. Plate Fabrication appears to be stagnate as several sectors are in limbo. Several factors are contributing to current conditions – global issues – domestic issues – pending November election – etc.” Service center who later stated, “We are prepared for an uptick – bring it on!”
“What goes up must come down.” HVAC Wholesaler
About the SMU Steel Buyers Sentiment Index
SMU Steel Buyers Sentiment Index is a measurement of the current attitude of buyers and sellers of flat rolled steel products in North America regarding how they feel about their company’s opportunity for success in today’s market. It is a proprietary product developed by Steel Market Update for the North American steel industry.
Positive readings will run from +10 to +100 and the arrow will point to the right hand side of the meter located on the Home Page of our website indicating a positive or optimistic sentiment.
Negative readings will run from -10 to -100 and the arrow will point to the left hand side of the meter on our website indicating negative or pessimistic sentiment.
A reading of “0” (+/- 10) indicates a neutral sentiment (or slightly optimistic or pessimistic) which is most likely an indicator of a shift occurring in the marketplace.
Readings are developed through Steel Market Update market surveys which are conducted twice per month. We display the index reading on a meter on the Home Page of our website for all to enjoy.
Currently, we send invitations to participate in our survey to almost 600 North American companies. Our normal response rate is approximately 100-170 companies. Of those responding to this week’s survey, 46 percent were manufacturing and 40 percent were service centers/distributors. The balance of the respondents are made up of steel mills, trading companies and toll processors involved in the steel business.
Click here to view an interactive graphic of the SMU Steel Buyers Sentiment Index or the SMU Future Steel Buyers Sentiment Index.


