

Market Data

July 10, 2016
SMU Flat Rolled Market Trends Analysis: Demand
Written by John Packard
Flat rolled steel industry participants continue to be optimistic about the markets, according to the recent flat rolled market trends analysis conducted by Steel Market Update. However, we are seeing a slightly less optimistic trend for this time of year compared to what we were reporting at the same point in time in 2014 and 2015.
Twice per month Steel Market Update conducts a trends analysis of the flat rolled steel market. We invite approximately 550 companies to participate and our normal response rate is about 100-125 responses for each survey.
In the analysis done last week 46 percent of the respondents were manufacturing companies, 40 percent steel service centers, 6 percent trading companies, 4 percent steel mills and another 4 percent were toll processors. We intentionally heavy load the survey with manufacturing and distributors as that is where we believe we can gather the most relevant information about pricing, purchasing, sales, sentiment and other market trends important to those in the industry.
Demand
One of the areas that we review in a number of different ways is that of demand. We begin the process by having all of the respondents responding to a group of questions before being broken up into the various industry groups referenced above.
As a group we have been witnessing a slowing of the “improvement” trend since the beginning of the second quarter when 47 percent of our respondents reported demand as “improving” for their products. However, we are not seeing the opposite extreme, that demand is “declining,” as taking its place.
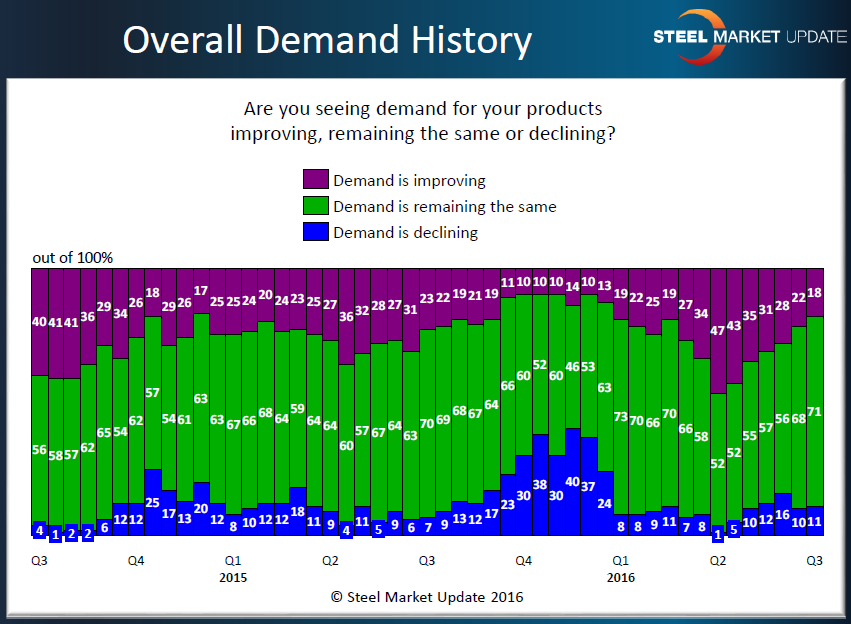
We see a decline of those reporting growing demand at this time of year. We believe it is mainly due to seasonal slowdown in some end products at this time of the year. Last year we saw very similar numbers to what we gathered this past week. In early July 2015 we had 23 percent of our respondents reporting demand as improving, 70 percent as remaining the same and 7 percent as declining.
Once we separate the various industry segments we ask other questions in an effort to determine if demand is better or worse than previous surveys as well as different than what we were seeing in prior years.
Manufacturing companies were asked if they were buying more, less or the same amount of steel as they did one year earlier. The responses from last week were very similar to what we have seen over the past two years (2014 & 2015) with 38 percent of the manufacturing respondents reporting their company buying more steel (2014 = 37% and 2015 = 31 percent), 46 percent reporting buying the same amount of steel (2014 = 45% and 2015 = 56 percent) and 16 percent reporting buying less steel (2014 = 18% and 2015 = 13%).
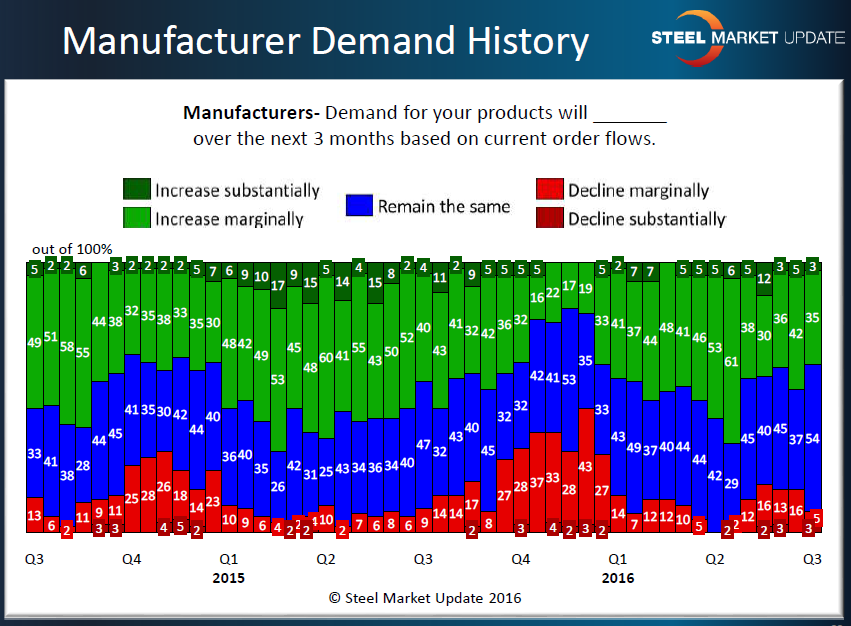
We also asked manufacturing companies to tell us what demand for their products will be in the next 3 months based on current order flows. As you can see by the graphic below, manufacturers are less optimistic at this point of the year than than they were in 2014 and 2015.
We also asked the steel distributors how they are seeing the releases of steel by their customers this year compared to last. We found 26 percent of those responding reporting their clients are releasing more steel (2014 = 57% and 2015 = 33 percent) another 13 percent reported their customers are releasing less steel (2014 = 7% and 2015 = 28%) while a 61 percent majority of respondents reported their customers are releasing the same amount of steel as one year ago (2014 = 36% and 2015 = 39%).
What Our Respondents Were Saying
“We’re busy, but it’s our time to be busy. Buying and using lots of steel.” Manufacturing company
“Automotive slowdown in July – normal.” Service center
“Business much better in q2 than q1 and currently steady.” Service center
“Demand has dropped slightly as price increases are applied to the market.” Manufacturing company
“Business conditions as they exist today are horrid. Plate Fabrication appears to be stagnate as several sectors are in limbo. Several factors are contributing to current conditions – global issues – domestic issues – pending November election – etc.” Service center who went on to say about demand being the same as one year ago with, “and note- the same – is not good enough.” Service center
“Business is generally positive in most markets.” Service center
“Very much wait and see market.” Service center
“[Releases] not at the levels they need to be – things need to improve.” Service center
“Construction market is still picking up…” Service center


