

Market Data

July 11, 2016
Shipments and Supply of Sheet Products through May 2016
Written by Peter Wright
This report summarizes total steel supply from 2003 through May 2016 and year on year changes. It then compares domestic mill shipments and total supply to the market. It quantifies market direction by product and enables a side by side comparison of the degree to which imports have absorbed demand. Sources are the American Iron and Steel Institute and the Department of Commerce with analysis by SMU.
Table 1 shows both apparent supply and mill shipments of sheet products (shipments includes exports) side by side as a three month average through May, for both 2015 and 2016.
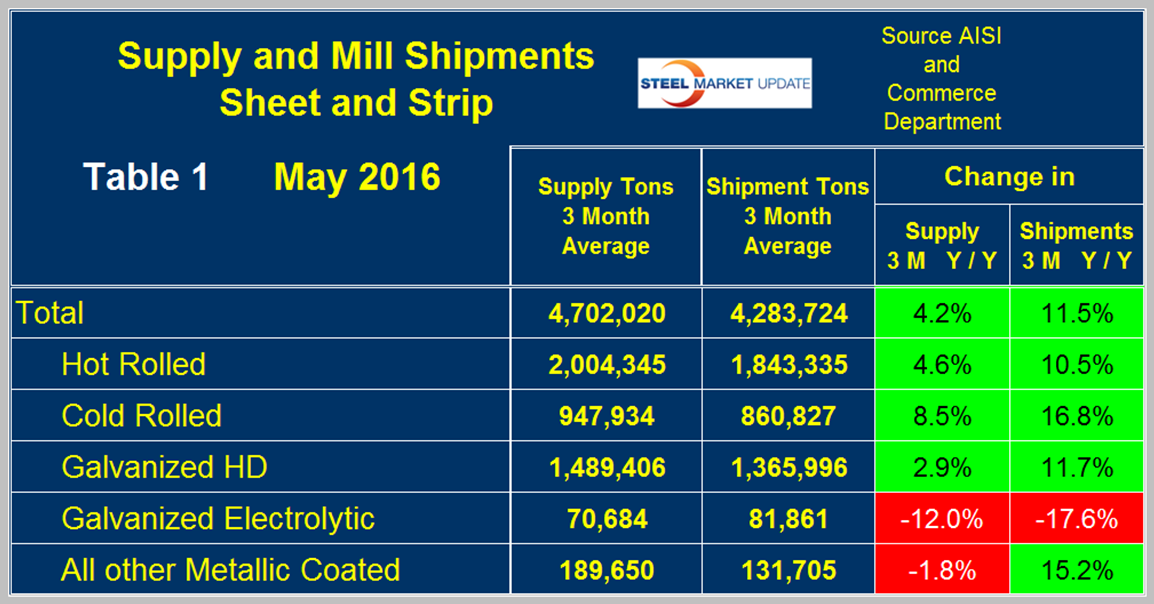
Apparent supply is a proxy for market demand. Comparing these two time periods total supply to the market was up by 4.2 percent and shipments were up by 11.5 percent. The fact that shipments were up by more than supply means that imports put less pressure on the market than they did in most of 2015. Table 1 breaks down the total into product detail and it can be seen that this was true for all products except electro galvanized which is a special case because EG has a trade surplus. The other sheet products all have a net trade deficit.
A review of supply and shipments separately for individual sheet products is given below.
Apparent Supply
Apparent Supply is defined as domestic mill shipments to domestic locations plus imports. In three months through May 2016 the average monthly supply of sheet and strip was 4.702 million tons, up by 4.2 percent year over year as mentioned above but up by 10.7 percent comparing March through May with the previous three months. The short term improvement (3 months) compared to the long term improvement (12 months) means that momentum continues to be very positive. Table 2 shows the change in supply by product on this basis through May. Momentum was positive for all products including electro-galvanized where the decline slowed.
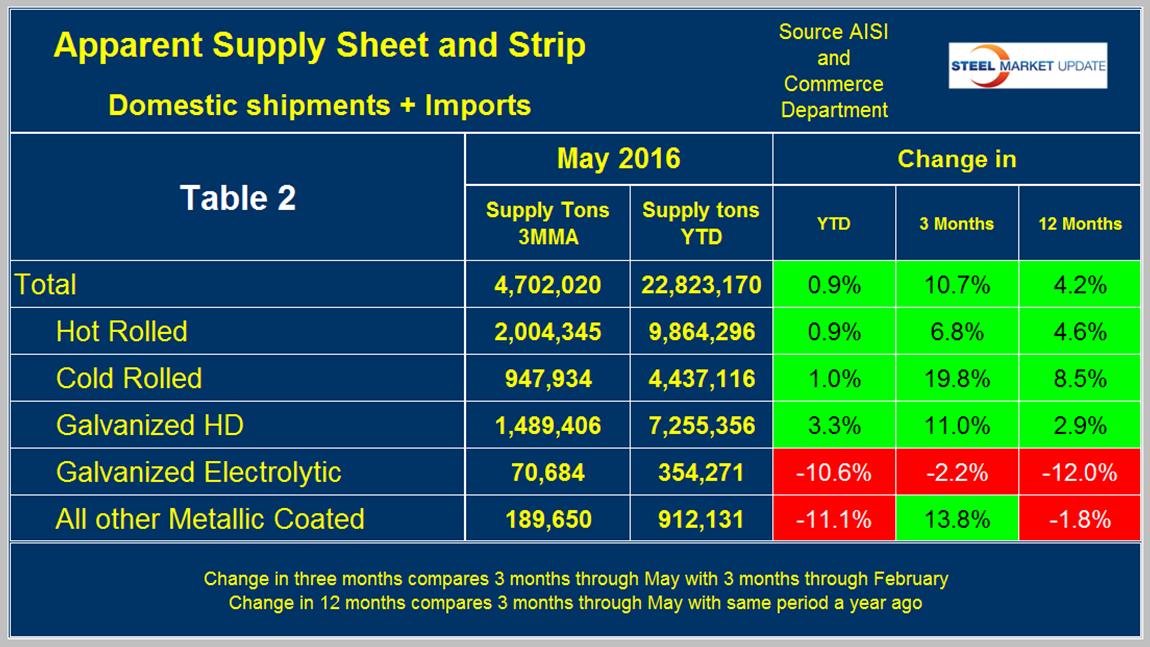
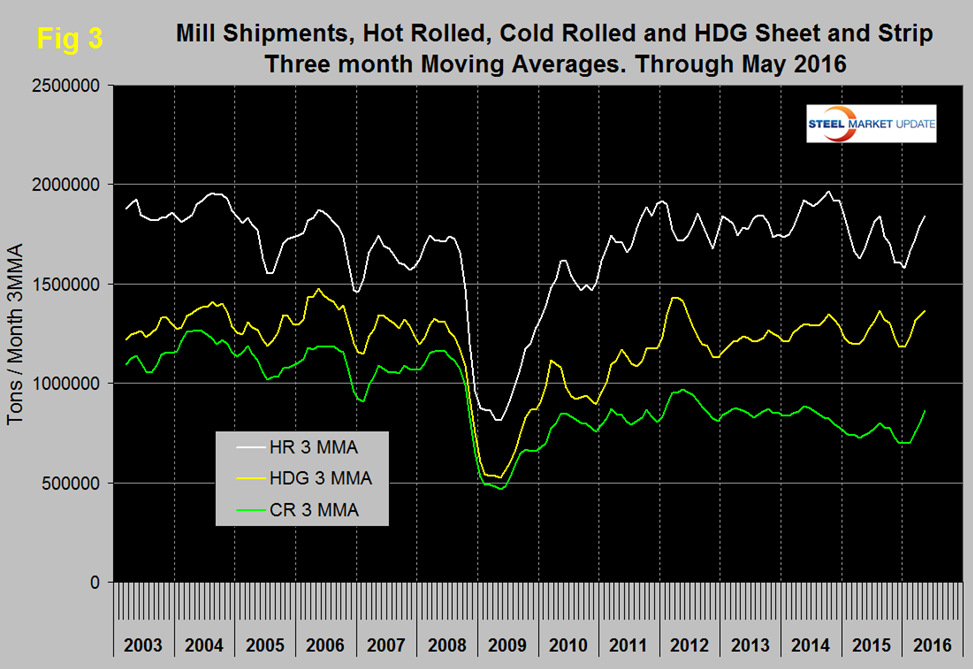
Figure 1 shows the long term supply picture for the three major sheet and strip products, HR, CR and HDG since January 2003 as three month moving averages and the improvement that has occurred this year.
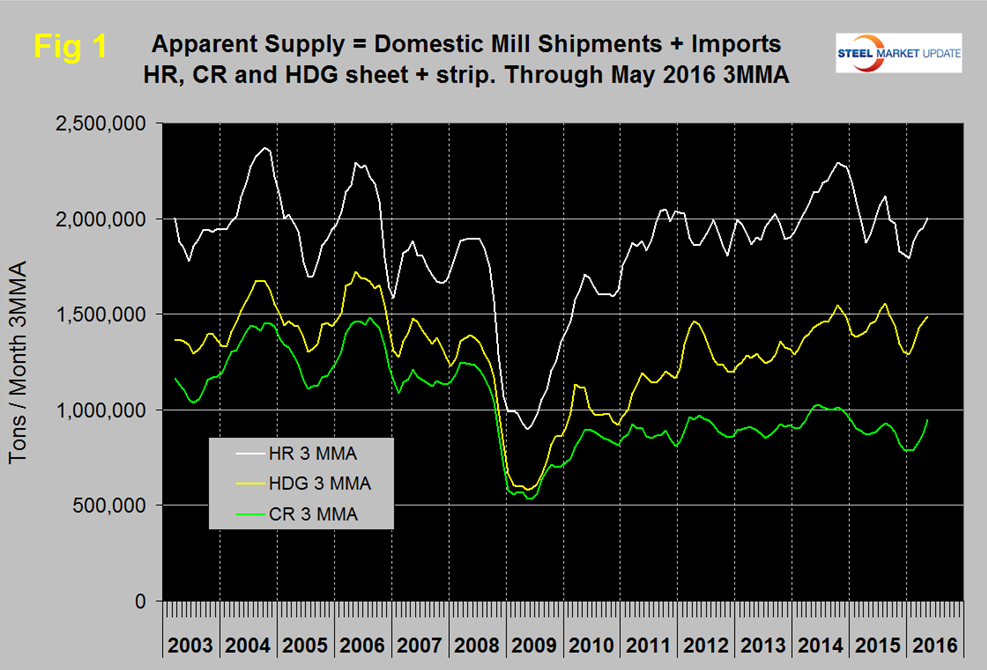
Figure 2 shows import market share of sheet products and includes long products for comparison.

Based on a 3MMA the import market share of sheet products has declined more or less continuously since February 2015 when it was 24.3 percent to 17.3 percent in May 2016. Long product import market share peaked at 29.4 in May last year, declined to 24.5 percent in July and now stands at 25.5 percent in this latest data.
Mill Shipments
Table 3 shows that total shipments of sheet and strip products including hot rolled, cold rolled and all coated products were up by 11.5 percent in 3 months through May year over year and up by 12.6 percent comparing three months through May with three months through February.
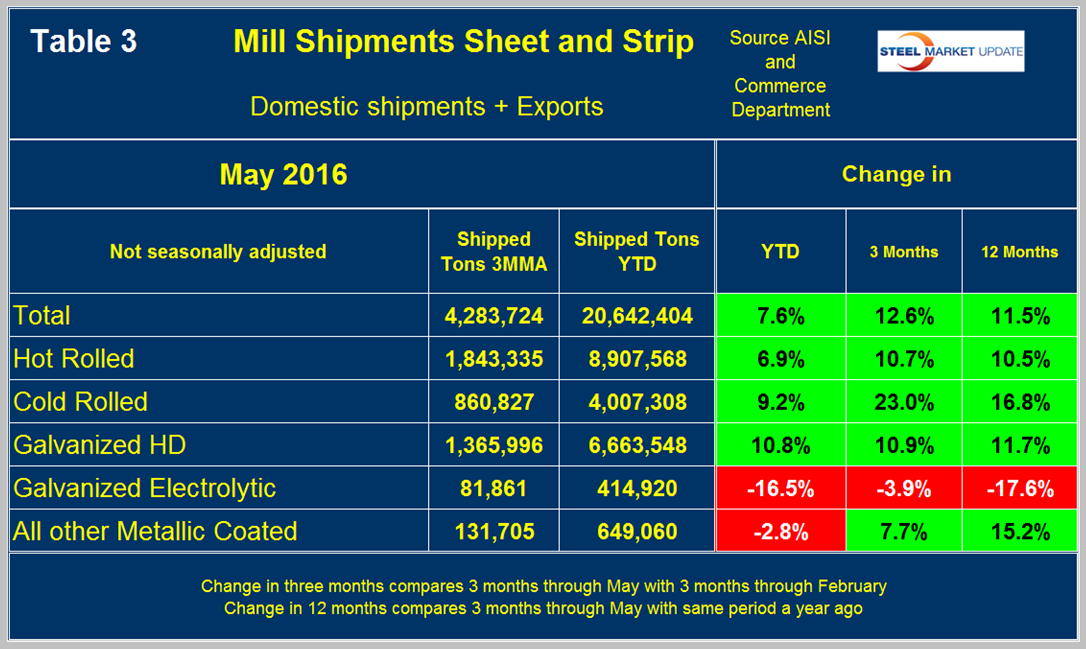
Momentum for the total shipments of sheet and strip products was positive because the 3 month growth (12.6 percent) was greater than the 12 month result (11.5 percent). This was not true of all the individual products. Hot rolled had a small positive momentum and cold rolled was very positive. HDG had small negative momentum and other metallic coated which is mainly Galvalume had a 7.5 percent negative momentum. Shipments of electro-galvanized continued to contract but at a much slower rate. Figure 3 puts the shipment results for the three main products into the long term context since January 2003. All three have had positive growth this year.
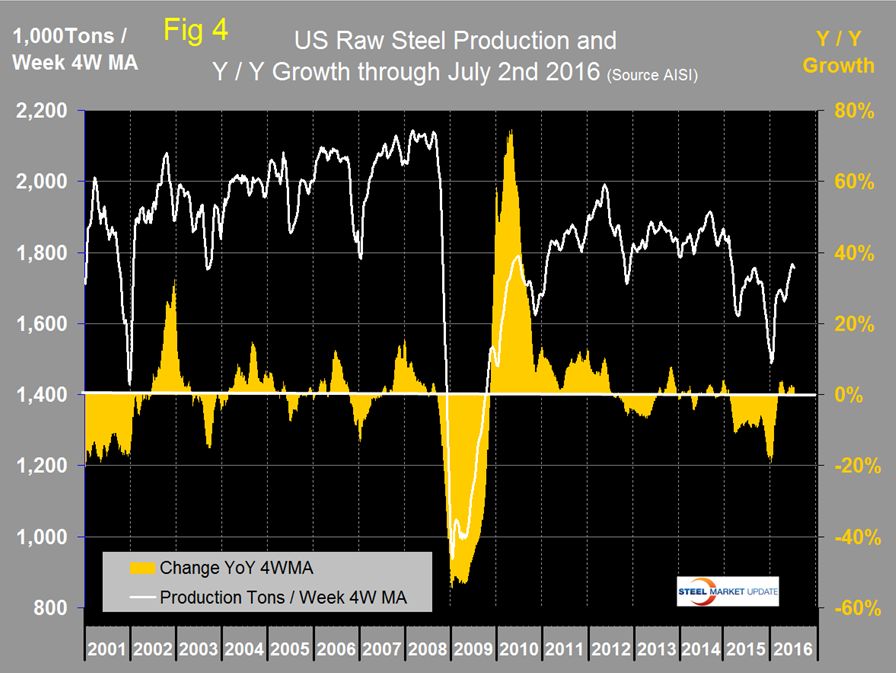
SMU Comment: The numbers in this report illustrate why it’s necessary to look at different time periods to try to understand the whole picture. We could draw different conclusions based on which time period we chose to describe. Another problem is that it’s now mid-July and the latest data we have for shipments and supply is for May. The AISI puts out weekly data for crude steel production the latest for which was w/e July 2nd. This provides the most current data for steel mill activity. Figure 4 shows the Y/Y change in weekly crude output on a four week moving average basis. Growth became positive in w/e March 5th and in the latest 19 weeks there has only been one week with negative Y/Y growth.
In April we concluded that based on the above, on the results of our key market indicators analysis, buyer sentiment and the decline in service center excess that March was an inflection point. That conclusion still seems valid and we expect that for at least the next few months we will continue to see improvements in both supply and mill shipments.


