

Market Data
July 17, 2016
Oil and Gas Prices and Rotary Rig Counts in July 2016
Written by Peter Wright
The price of oil and natural gas have much to do with sales of oil country tubular goods (OCTG) and related steel products. The energy markets represent a large portion of the hot rolled coil used to make pipe and tube, storage facilities as well as equipment used to drill and pump oil and natural gas.
Figure 1 shows historical oil and gas prices since January 2000. The daily spot price of West Texas Intermediate (WTI) closed at $44.73 on July 11th having been above $50 on the 7th through the 9th of June according to the Energy Information Administration (EIA). Brent closed at $44.04 on July 11th.
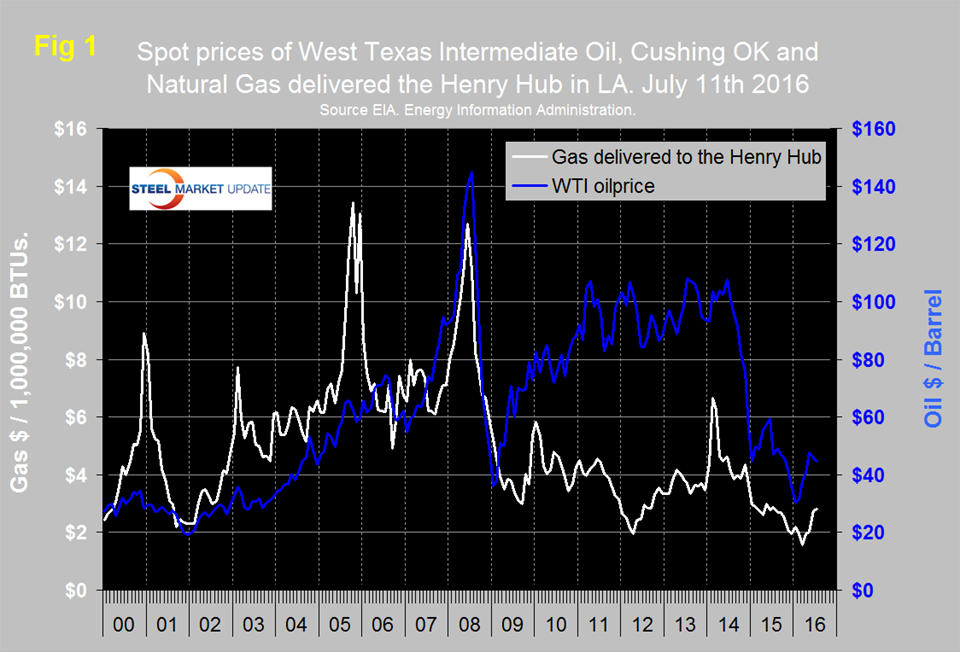
The price of natural gas, delivered the Henry Hub in Louisiana closed at $2.82/MM BTU on July 9th, up from $1.57 on March 4th. July 9th was the latest data published by the EIA. The price had trended down for two years prior to March 14th therefore the recent turnaround is encouraging. Natural gas is expected to fuel the largest share of electricity generation in 2016 at 33 percent, compared with 32 percent for coal. In 2017, natural gas and coal are both forecast to fuel 32 percent of electricity generation.
On July 12th the EIA published their short term energy outlook and had this to say; “U.S. crude oil production is projected to decrease from an average of 9.4 million b/d in 2015 to 8.6 million b/d in 2016 and to 8.2 million b/d in 2017. The forecast reflects declining Lower 48 onshore production that is partly offset by growing production in the federal Gulf of Mexico. EIA estimates that total U.S. crude oil production has fallen by 1.1 million b/d since April 2015 to an average of 8.6 million b/d in June 2016. Almost all of the production decline was in the Lower 48 onshore. Based on the current oil price forecast, EIA expects oil production to continue declining in most Lower 48 onshore oil production regions through mid-2017. The expectation of reduced cash flows in 2016 and 2017 has prompted many companies to scale back investment programs, deferring major new undertakings until a sustained price recovery occurs. The prospect of tighter lending conditions will likely limit the availability of capital for many smaller producers, giving rise to distressed asset sales and consolidation of acreage holdings by firms that are more financially sound. Lower onshore investment is expected to reduce the count of oil-directed rigs and well completions in 2016 and 2017. The current price outlook is expected to limit onshore drilling activity and well completions, despite continued increases in rig and well productivity and falling drilling and completion costs. Average rig counts reported by Baker Hughes increased by 10 rigs from May to June, with an average of 417 total rigs in operation during June, down from more than 600 in January. In EIA’s forecast, low rig counts continue to limit production through 2017.”
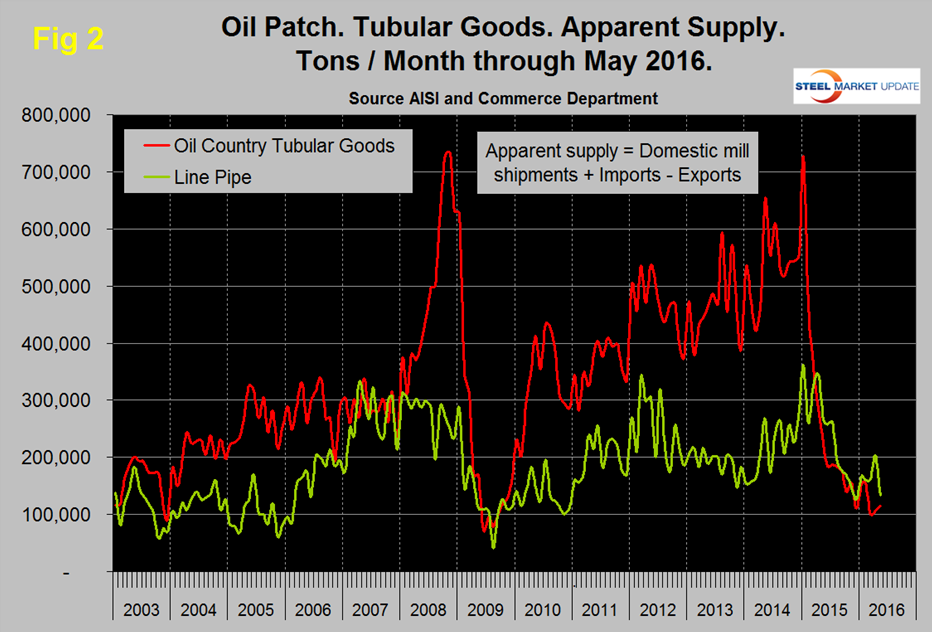
Figure 2 shows the apparent supply of the two main steel tubular products used in oil and gas production from January 2003 through May 2016. (Apparent supply is a proxy for demand.) Following a weak December, line pipe demand coincided with the rising oil price but dived abruptly in May when the import volume which was 159,000 tons in April, the highest volume since July last year fell to 91,000 in May. Licensed imports in June returned to a more currently normal level of 122,000 tons. The supply of OCTD which had dived in March recovered slightly in April and May.
The total number of operating rigs in the US and Canada on July 15th was 540, up from 445 on May 27th. The improvement was evident for both gas and oil rigs in both the US and Canada. The increase in total rig count occurred for seven straight weeks. Figure 3 shows the Baker Hughes US Rotary Rig Counts for oil and gas equipment in the US through July 15th. (Explanation below). The uptick in the US oil rig count was the first since July of last year with an increase from 316 on May 27th to 357 on July 15th. Based on the most recent available data, the EIA estimates that oil production from hydraulically fractured wells now makes up about half of total U.S. crude oil production.
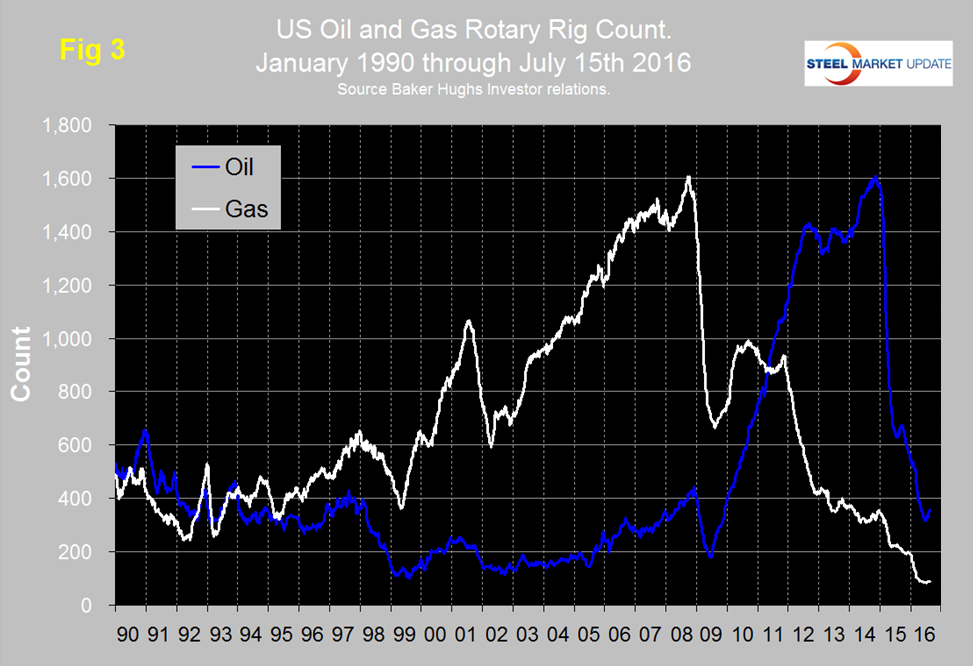
The decline in the gas rig count may have ended with an increase of 7 rigs since June 3rd to 89 on July 15th.
On a regional basis in the US, the big three states for operating rigs are Texas, Oklahoma and North Dakota. Texas at 202 on July 15th was back to where it was on April 1st but down from 318 at the beginning of the year, Oklahoma at 59 has seen only an increase of one in the last five weeks and was down from 87 at the beginning of the year. North Dakota at 27 on July 15th was down from 53 at the beginning of the year but up by 5 from its low point on May 27th.
Baker Hughes Rotary Rig Count: These are a weekly census of the number of drilling rigs actively exploring for or developing oil or natural gas in the United States. Rigs are considered active from the time they break ground until the time they reach their target depth and may be establishing a new well or sidetracking an existing one. The Baker Hughes Rotary Rig count includes only those rigs that are significant consumers of oilfield services and supplies.


