

Market Data

July 20, 2016
Currency Update for Steel Trading Nations
Written by Peter Wright
The Broad Index value of the US $ is reported several days in arrears, the latest value we have was dated July 15th (Figure 1).
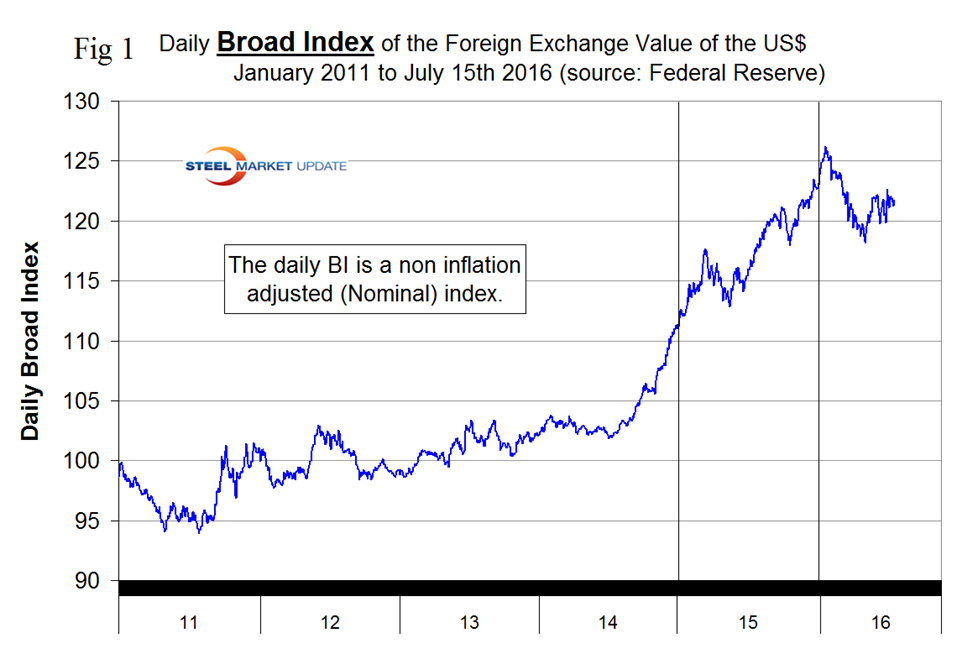
Our previous report was current as of June 26th which shortly followed the FOMC meeting of June 14th and 15th at which it was decided not to raise rates. This was a nonevent in terms of dollar value since traders had correctly anticipated the lack of action following the release of the May employment result. Prior to the release of May’s employment result the dollar was trading above its 30 day moving average but that changed when the poor results were reported. On July 12th Economy.com described the sensitivity of currency values to interest rates as follows: “Investors from all over the world buy Treasury bonds, and when deciding whether to invest they compare the risk-adjusted returns with those on other global assets. With yields on most European and Japanese bonds now firmly negative, given the aggressive bond buying by the European Central Bank, the Bank of Japan, and perhaps soon the Bank of England, Treasuries appear very attractive. And in times of global stress, like now, they appear especially enticing, as they are far and away the safest investment in the world.”
Table 1 shows the value of the US $ measured in the currencies of 16 steel and iron ore trading nations on July 18th. It reports the changes in one year, three months, one month and seven days for each currency and is color coded to indicate strengthening of the dollar in red and weakening in green.
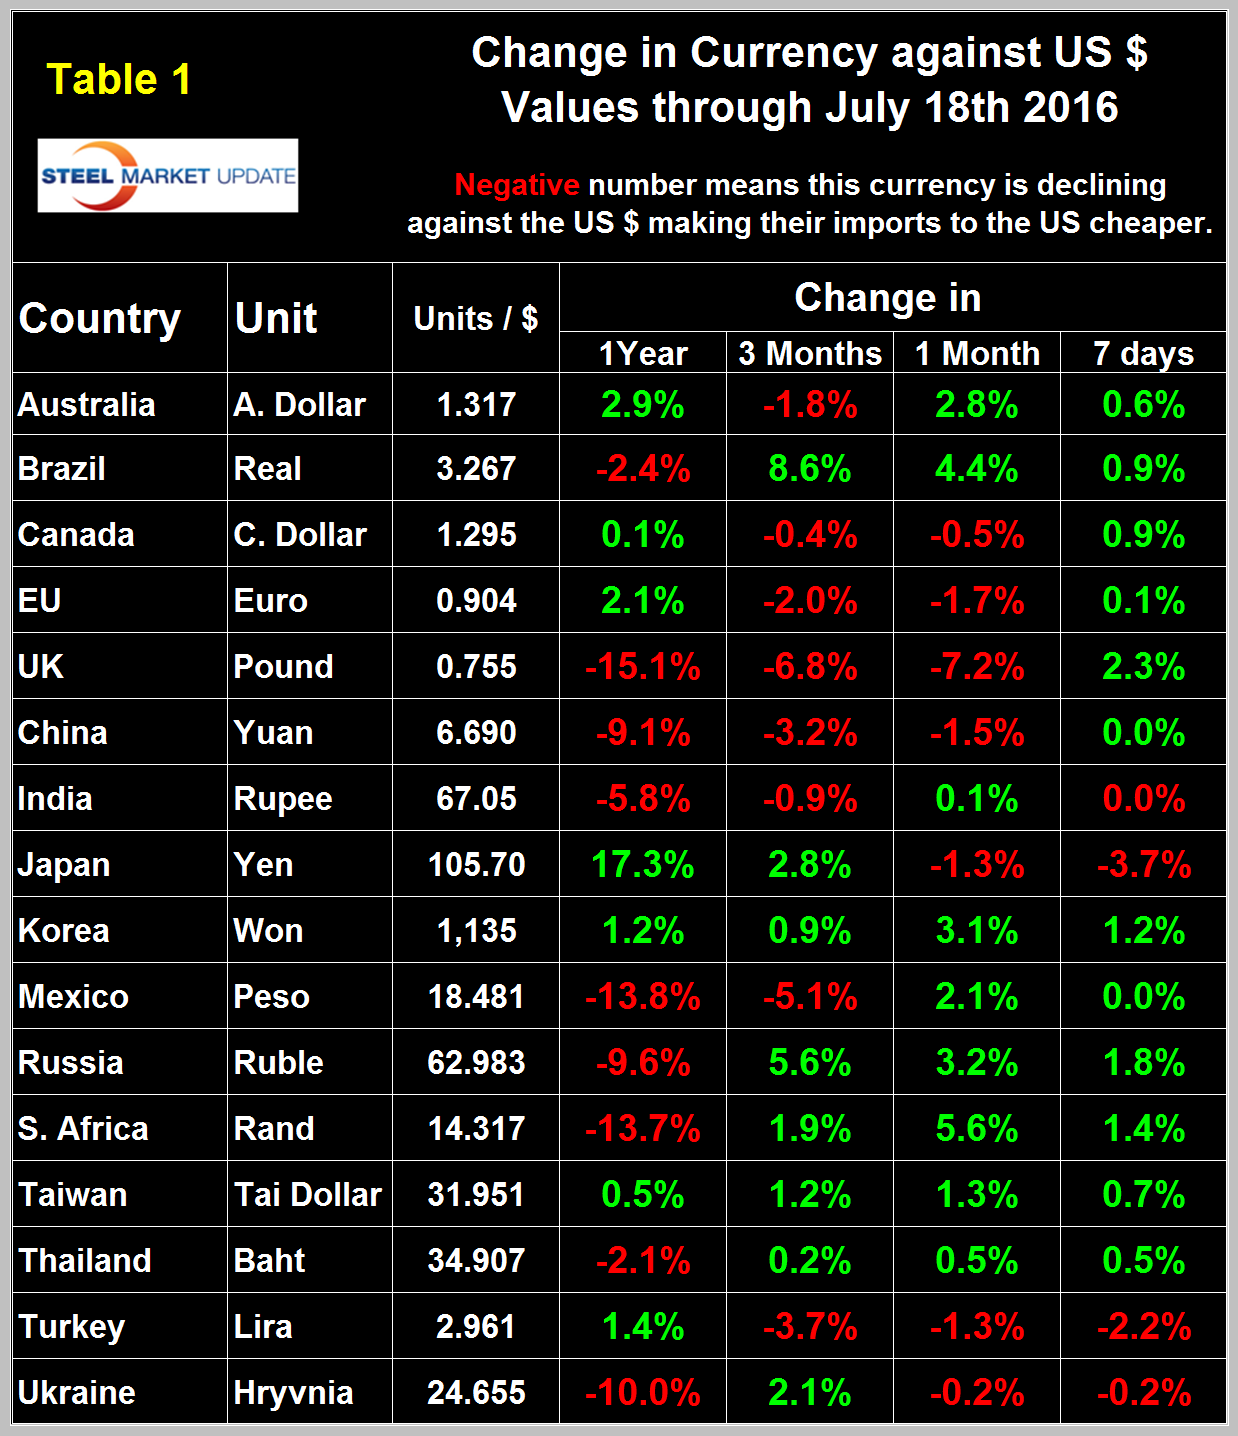
We regard strengthening of the US Dollar as negative and weakening as positive because the effect on net imports. An estimated 25 percent of the U.S. economy had some involvement in international trade therefore currency swings can have a large effects on the economy in general and of the steel industry in particular. The poor May employment report made traders anticipate no Fed action two weeks in advance but the very strong June employment numbers were a nonevent in terms of dollar value. At the seven day level shown in Table 1 and rolled back another seven days to July 7th, the dollar has been extremely steady ranging between + 0.2 percent and –0.4 percent. Compared to our previous report of June 26th there was a slight weakening of the dollar at the one month level on July 18th. In 30 days prior to June 26th the dollar weakened against 11 of the 16 steel trading currencies. In 30 days prior to July 18th it weakened against 9 of 16. The two reversals were in the values of the Turkish Lira and the Ukrainian Hryvnia. There was no change in the trend of the other 14 currencies.
In each of these reports we comment on a few of the 16 steel trading currencies listed in Table 1 and include extracts from sources that we have come across that we deem credible. Not surprisingly there has been a dearth of currency reports in the financial press since our last update so external comments are scarce in this update. Charts for each of the 16 currencies listed in Table 1 are available through July 18th for any reader who requests them.
The Euro
On July 18th it took 1.1062 US dollars to buy one Euro (Figure 2).
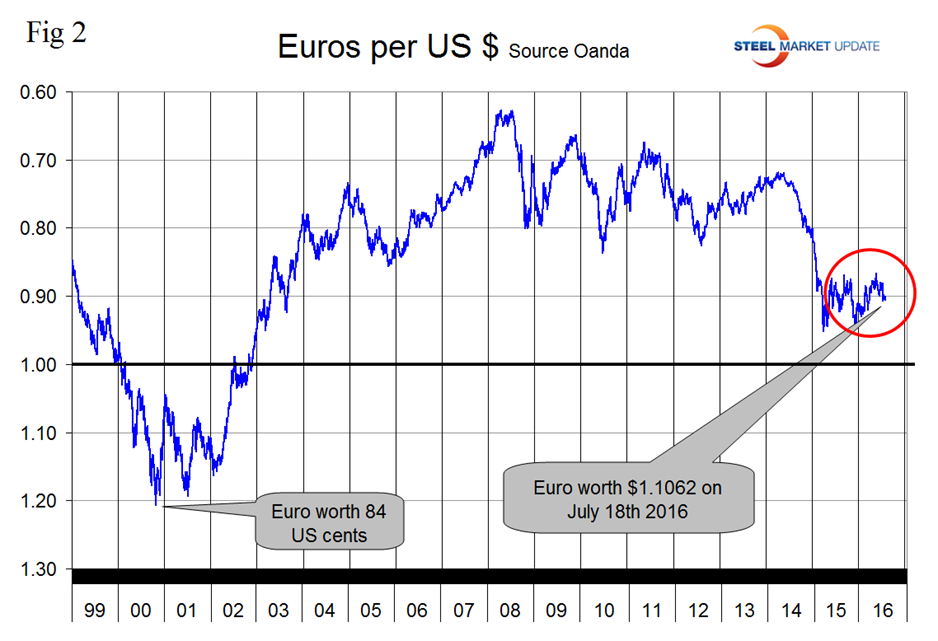
Through that date the Euro had weakened by 2.0 percent in 3 months, by 1.7 percent in one month and appreciated by 0.1 percent in 7 days. The Euro had a recent low of 1.0580 on November 30th.
The Turkish Lira
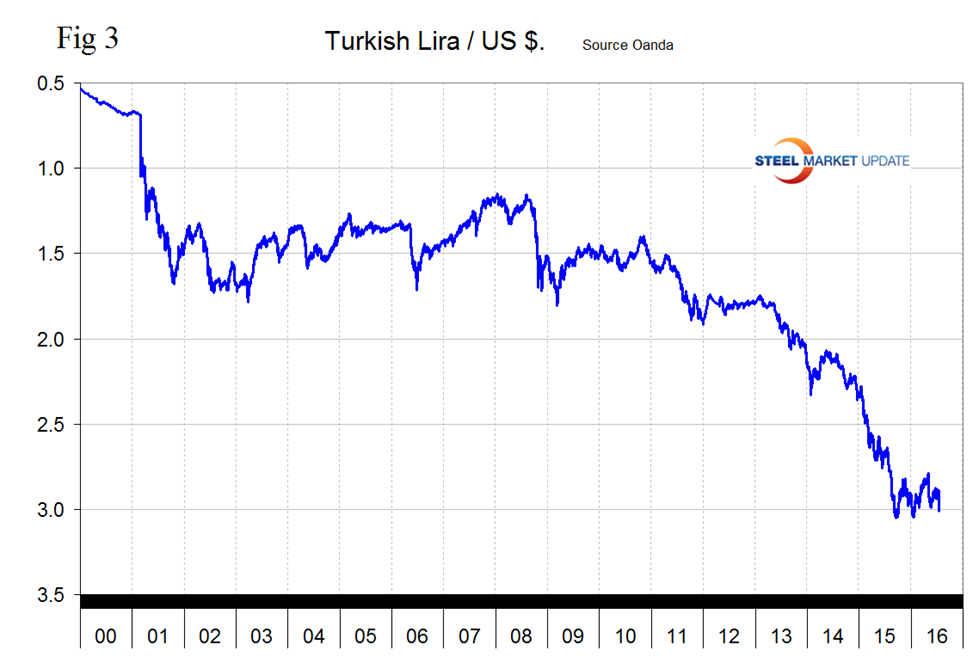
The Lira took a hit of 4.2 percent on the 16th following the failed coup on the 15th and is down by 1.3 percent in the last month (Figure 3). It currently takes 2.96 Lira to exchange for a US dollar. The all-time low was 3.0522 on September 15th last year.
The Japanese Yen
Figure 4 shows the value of the Yen since January 2000. The Yen has had a bull run for a year now and in that period has strengthened by 17.3 percent against the US dollar. There has been a softening of 3.7 percent in the last 7 days. The Yen briefly broke through 100/US $ on July 1st before retreating to 105.701 on July 18th.
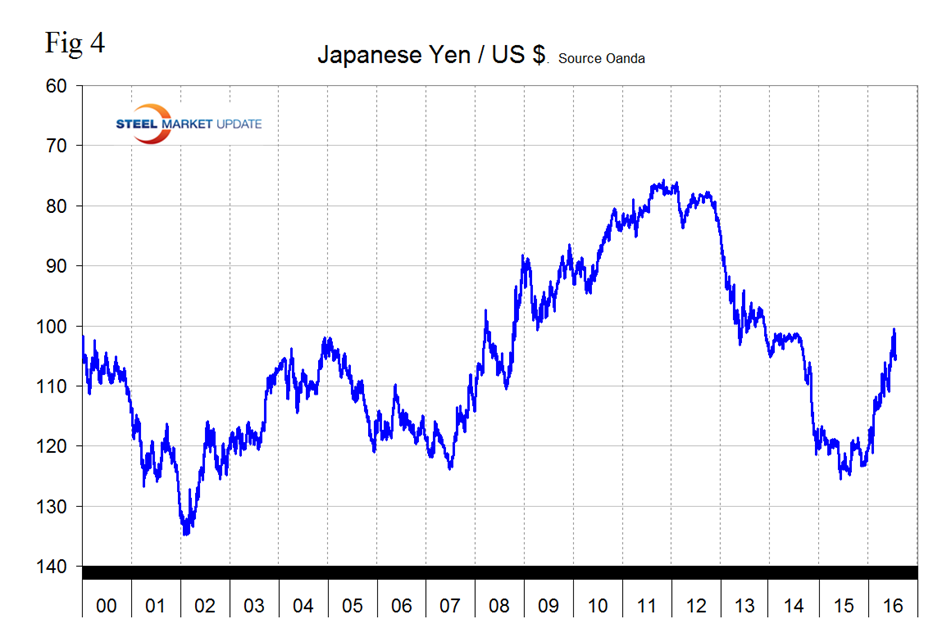
The Financial Times had this to say in early July: The past few weeks have not been happy ones for many central bankers – and none more so than Haruhiko Kuroda, the hapless governor of the Bank of Japan. That is because the threat of moving rates deeper into negative territory and buying up even more assets has done nothing to weaken the yen down as he desires. Brexit, which briefly sent the yen beyond the ¥100 mark against the dollar on July 1st, is a fresh headwind. The Bank of Japan is likely to move rates from negative 0.1 per cent to minus 0.3 per cent come the end of July, increase its holdings of ETFs and increase its purchases of Japanese Reits, economists at JPMorgan in Tokyo predict. With the yen ever stronger, Abenomics and the desired impact of central bank policies are going into reverse. Abenomics was never about real reform. Instead, it was merely meant to weaken the currency, undercutting competitors like Korea and China and allowing Japan Inc. to more easily export its cars and other manufactured goods to the rest of the world.
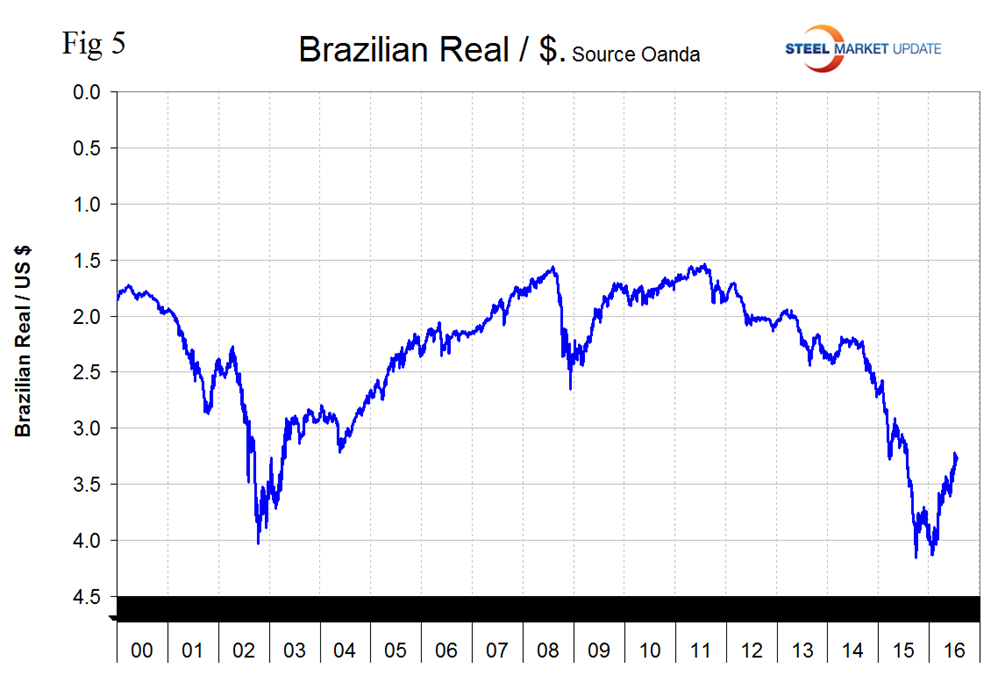
Brazilian Real
The Brazilian Real has also been on a tear this year, up by 26.45 percent from 4.1315 on January 22nd to 3.06 on July 18th (Figure 5).
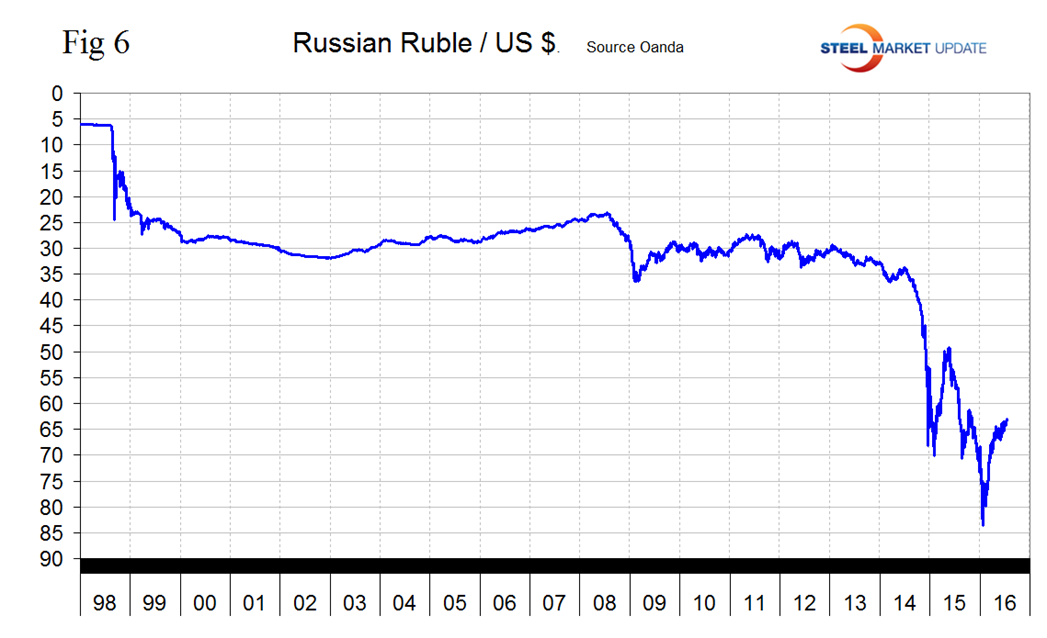
The Russian Ruble
Figure 6 shows the history of the Ruble against the US $ since January 1998. The Ruble has appreciated by 32 percent from 83.67 on January 21st to 62.98 on July 18th. This has made up all its losses since last August.
Explanation of Data Sources: The broad index is published by the Federal Reserve on both a daily and monthly basis. It is a weighted average of the foreign exchange values of the U.S. dollar against the currencies of a large group of major U.S. trading partners. The index weights, which change over time, are derived from U.S. export shares and from U.S. and foreign import shares. The data are noon buying rates in New York for cable transfers payable in the listed currencies. At SMU we use the historical exchange rates published in the Oanda Forex trading platform to track the currency value of the US $ against that of sixteen steel trading nations. Oanda operates within the guidelines of six major regulatory authorities around the world and provides access to over 70 currency pairs. Approximately $4 trillion US $ are traded every day on foreign exchange markets.


