

Market Data

July 27, 2016
Consumer Confidence in July 2016
Written by Peter Wright
Sources for the following article are the Conference Board and SMU analysis. Please see the end of this piece for an explanation of the indicator.
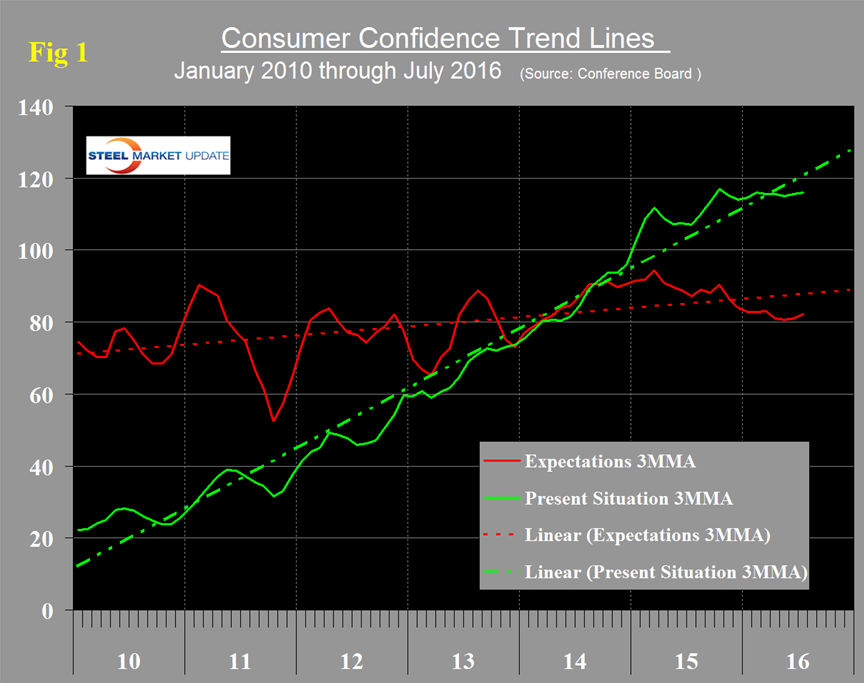
Consumer Confidence jumped from 92.4 in May to 97.3 in June then eked out a small gain to 97.4 in July. Included below is the official news release from the Conference Board. The three month moving average (3MMA) rose from 94.4 in May to 94.8 in June then to 95.7 in July. We prefer to smooth the data in this way because of monthly volatility which in the case of consumer confidence has been quite extreme since the beginning of last year. The composite index is made up of two sub-indexes. These are the consumer’s view of the present situation and his/her expectations for the future. The 3MMA of the present situation is now below its six year trend and that of expectations has been below its six year trend for the last ten months (Figure 1).
The historical pattern of the 3MMA of the composite, the view of the present situation and expectations are shown in Figure 2.
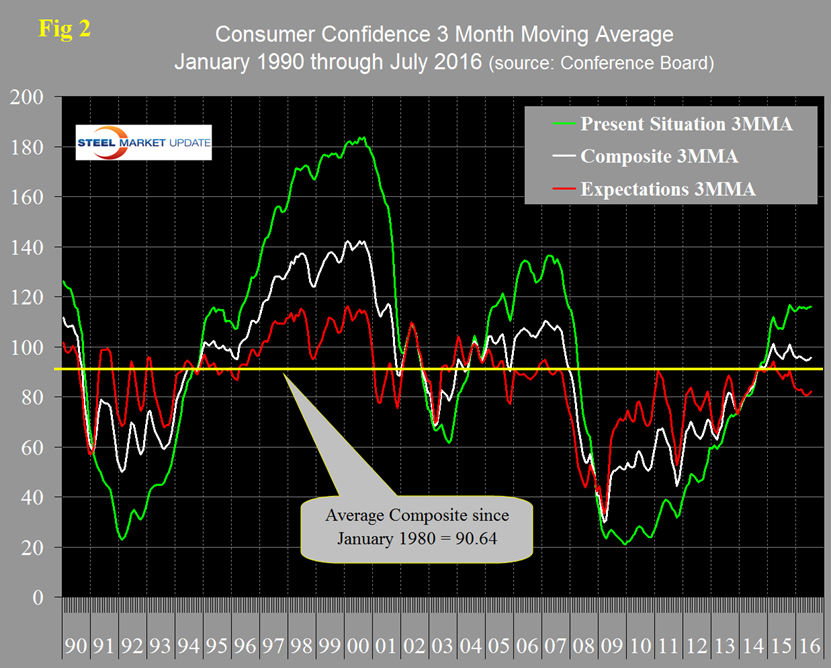
The progression of the 3MMA of the composite was positive throughout 2014 into early 2015 but has been trending down since then. Since January last year the improvement in the present situation has been more than countered by the deterioration in consumer expectations. The improvement in June and July is a welcome turnaround. Comparing July 2016 with July 2015 (y/y) the 3MMA of the composite was up by 0.6, the present situation was up by 8.9 and expectations were down by 5.0 (Table 1).
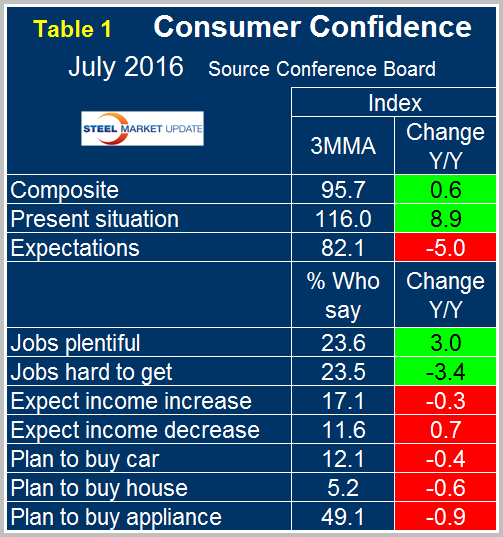
Comparing Table 1 with each of the versions that we published in the last four months we see that the employment situation was unchanged. In all five months the perception of job availability was improving but expectations for wage improvement were deteriorating. Plans to buy homes were positive every month from May 2015 through May 2016 but were negative in June and July. Plans to buy appliances improved every month this year until this July result when intentions became negative. Plans to buy a car deteriorated after being positive or neutral in April, May and June.
SMU Comment: Consumer confidence is positively correlated with personal consumption which accounts for about 2/3 of GDP. Ultimately the growth of GDP positively drives steel consumption therefore this report is heading in the right direction. However in the detail this report is not so good. Employment impressions continue to be mixed and intentions for major purchases have weakened.
The official news release from the Conference Board reads as follows and is entirely based on monthly changes. This is a highly regarded indicator which we believe needs to be examined in a longer time context to get the real picture which is why we only consider three month moving averages and focus our comments on year over year results.
The Conference Board Consumer Confidence Index Virtually Unchanged in July
NEW YORK, July 26, 2016 /PRNewswire/ — The Conference Board Consumer Confidence Index, which had increased in June, was relatively unchanged in July. The Index now stands at 97.3 (1985=100), compared to 97.4 in June. The Present Situation Index increased from 116.6 to 118.3, while the Expectations Index edged down to 83.3 from 84.6 in June. The cutoff date for the preliminary results was July 14.
“Consumer confidence held steady in July, after improving in June,” said Lynn Franco, Director of Economic Indicators at The Conference Board. “Consumers were slightly more positive about current business and labor market conditions, suggesting the economy will continue to expand at a moderate pace. Expectations regarding business and labor market conditions, as well as personal income prospects, declined slightly as consumers remain cautiously optimistic about growth in the near-term.”
Consumers’ assessment of present-day conditions improved slightly in July. Those stating business conditions are “good” increased from 26.8 percent to 28.1 percent, however those saying business conditions are “bad” also rose, from 18.3 percent to 19.0 percent. Consumers’ appraisal of the labor market was little changed from last month. Those claiming jobs are “plentiful” declined marginally from 23.2 percent to 23.0 percent, however those claiming jobs are “hard to get” also decreased, from 23.7 percent to 22.3 percent.
Consumers’ optimism regarding the short-term outlook was slightly less favorable in July. The percentage of consumers expecting business conditions to improve over the next six months decreased from 16.6 percent to 15.9 percent, while those expecting business conditions to worsen increased from 11.2 percent to 12.3 percent.
Consumers’ outlook for the labor market was marginally more favorable than last month. The proportion expecting more jobs in the months ahead was virtually unchanged at 14.0 percent, while those anticipating fewer jobs decreased from 17.7 percent to 17.0 percent. The percentage of consumers expecting their incomes to increase declined from 18.2 percent to 16.6 percent; however the proportion expecting a decrease also declined, from 11.3 percent to 10.8 percent.
About The Conference Board
The Conference Board is a global, independent business membership and research association working in the public interest. Our mission is unique: To provide the world’s leading organizations with the practical knowledge they need to improve their performance and better serve society. The monthly Consumer Confidence Survey, based on a probability-design random sample, is conducted for The Conference Board by Nielsen, a leading global provider of information and analytics around what consumers buy and watch. The index is based on 1985 = 100. The composite value of consumer confidence combines the view of the present situation and of expectations for the next six months. The Conference Board is a non-advocacy, not-for-profit entity holding 501 (c) (3) tax-exempt status in the United States. www.conference-board.org.


