Analysis

August 13, 2016
June Heating and Cooling Equipment Shipment Data
Written by Brett Linton
Below is the latest release issued by the the Air-Conditioning, Heating, and Refrigeration Institute (AHRI) regarding residential and commercial heating and cooling equipment shipments through June 2016. You may read the press release on their website here.
Residential Storage Water Heaters
U.S. shipments of residential gas storage water heaters for June 2016 decreased 12.5 percent to 361,674 units, down from 413,536 units shipped in June 2015. Residential electric storage water heater shipments increased 7.5 percent in June 2016 to 346,193 units, up from 322,059 units shipped in June 2015.
For the year-to-date, U.S. shipments of residential gas storage water heaters decreased 12.3 percent to 2,152,855, compared to 2,453,831 units shipped during the same period in 2015. Residential electric storage water heater shipments decreased 13.0 percent year-to-date to 2,012,123 units, compared to 2,313,209 units shipped during the same period in 2015.
Commercial Storage Water Heaters
Commercial gas storage water heater shipments increased 11.2 percent in June 2016 to 8,377 units, up from 7,535 units shipped in June 2015. Commercial electric storage water heater shipments increased 57.1 percent in June 2016 to 11,697 units, up from 7,444 units shipped in June 2015.
Year-to-date U.S. shipments of commercial gas storage water heaters decreased 3.1 percent to 51,302 units, compared with 52,928 units shipped during the same period in 2015. Year-to-date commercial electric storage water heater shipments increased 46.9 percent to 62,775 units, up from 42,733 units shipped during the same period in 2015.
Warm Air Furnaces
U.S. shipments of gas warm air furnaces for June 2016 increased 6.9 percent to 274,953 units, up from 257,321 units shipped in June 2015. Oil warm air furnace shipments decreased 0.5 percent to 2,121 units in June 2016, down from 2,131 units shipped in June 2015.
Year-to-date U.S. shipments of gas warm air furnaces increased 5.5 percent to 1,289,146 units, compared with 1,221,416 units shipped during the same period in 2015. Year-to-date U.S. shipments of oil warm air furnaces decreased 6.6 percent to 13,171, compared with 14,108 units shipped during the same period in 2015.
Central Air Conditioners and Air-Source Heat Pumps
U.S. shipments of central air conditioners and air-source heat pumps totaled 1,022,363 units in June 2016, up 16.4 percent from 878,513 units shipped in June 2015. U.S. shipments of air conditioners increased 19.1 percent to 729,018 units, up from 611,900 units shipped in June 2015. U.S. shipments of air-source heat pumps increased 10.0 percent to 293,345 units, up from 266,613 units shipped in June 2015.
Year-to-date combined shipments of central air conditioners and air-source heat pumps increased 1.8 percent to 3,989,465 units, up from 3,920,763 units shipped in June 2015. Year-to-date shipments of central air conditioners increased 3.6 percent to 2,681,694 units, up from 2,588,401 units shipped during the same period in 2015. The year-to-date total for heat pump shipments decreased 1.8 percent to 1,307,771 units, down from 1,332,362 units shipped during the same period in 2015.
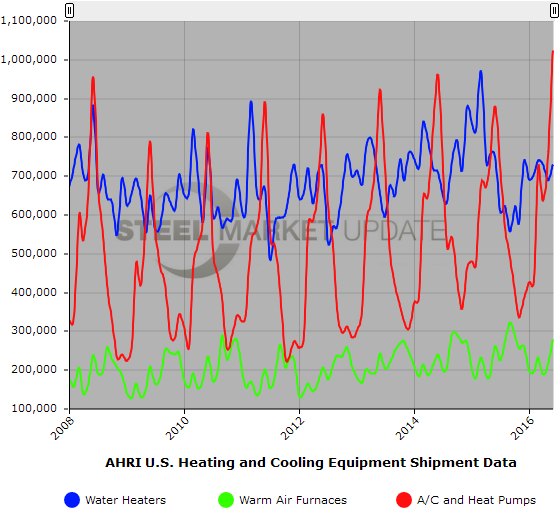
Below is a graph showing the history of water heater, warm air furnace, and air conditioner shipments. You will need to view the graph on our website to use it’s interactive features, you can do so by clicking here. If you need assistance with either logging in or navigating the website, please contact our office at 800-432-3475 or info@SteelMarketUpdate.com.