

Prices

September 9, 2016
Flat, Long, and Semi-Finished Imports through August 2016
Written by Peter Wright
Licensed data for August was reported by the Steel Import Monitoring System of the US Commerce Department on September 6th. An explanation of the methodology that we at SMU use to analyze the trade data is given at the end of this piece.
![]() Total rolled product licensed imports in the single month of August were 2,168,083 short tons with a three month moving average (3MMA) of 2,243,181 tons. We prefer not to dwell on single months results because of the extreme variability that can occur in individual products. In the comments below we use only three month moving averages to get a more representative picture.
Total rolled product licensed imports in the single month of August were 2,168,083 short tons with a three month moving average (3MMA) of 2,243,181 tons. We prefer not to dwell on single months results because of the extreme variability that can occur in individual products. In the comments below we use only three month moving averages to get a more representative picture.
Figure 1 shows the 3MMA through August licenses for semi-finished, flat and long products since January 2004.
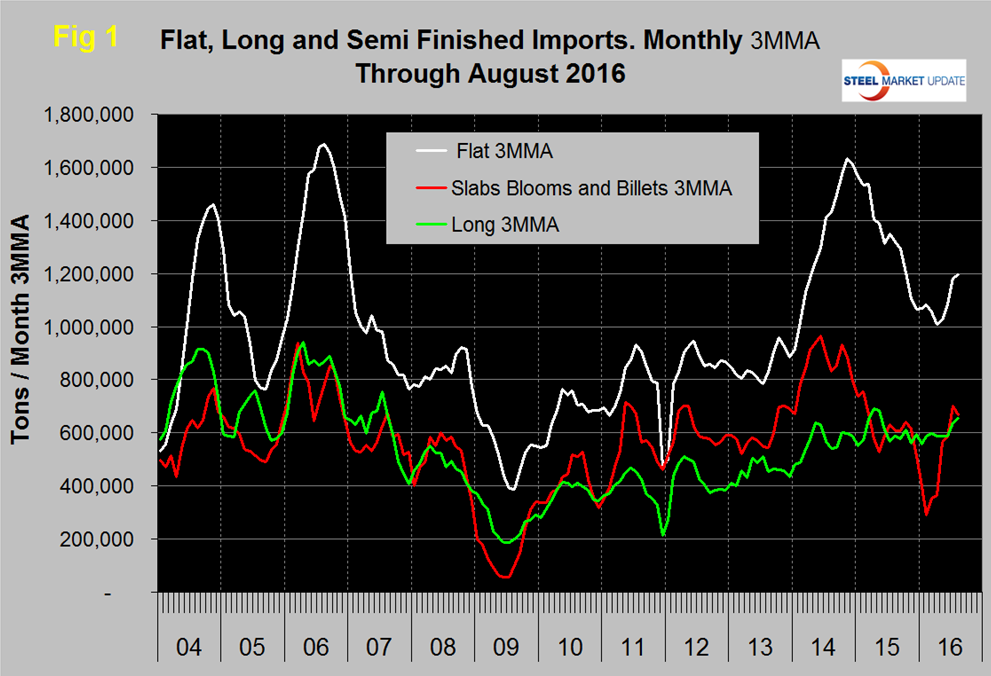
Imports of semi-finished in August were 677,366 tons with a three month moving average of 667,980 tons. February this year had a very low volume of semis as shown by the red line in Figure 1. “Flat” includes all hot and cold rolled sheet and strip plus all coated sheet products plus both discrete and coiled plate. The 3MMA of flat rolled imports peaked at 1,634,000 tons in November 2014, fell to 1,009,000 tons in April this year and has since climbed back to 1,196,000 tons in August. Long product imports have been range bound between 519,000 tons and 772,000 tons since March 2014 with no particular trend evident. In August the 3MMA of long product imports was 654,000 tons.
Figure 2 shows the trend of sheet and strip products since January 2004.
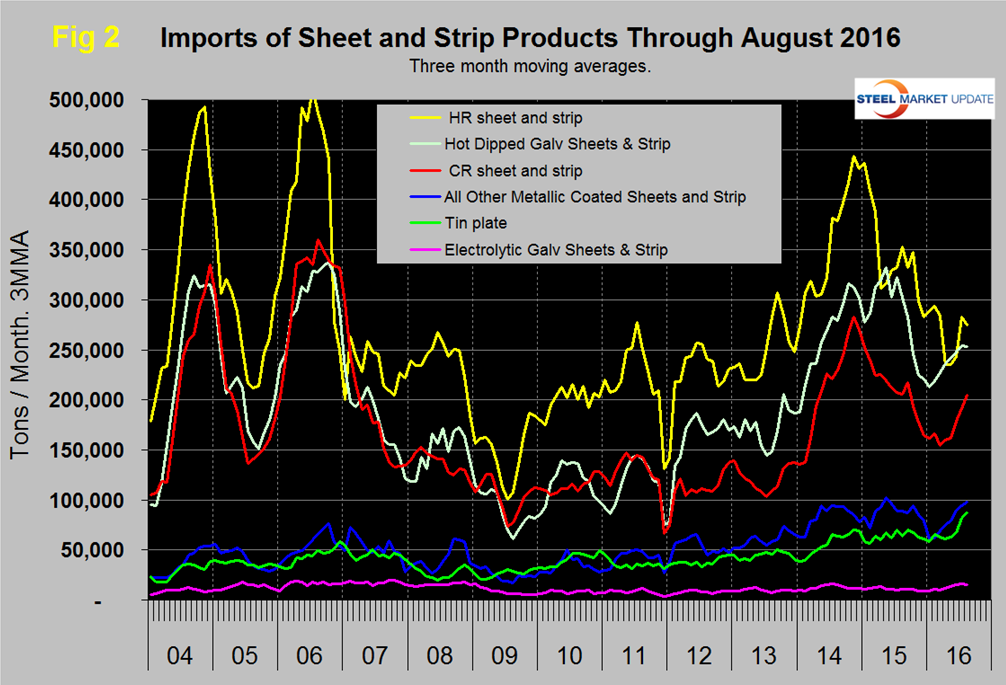
HRC and HDG decreased slightly in August but CRC, other metallic coated (mainly Galvalume) and tin plate continued to increase. Electro-galvanized keeps plodding along.
Table 1 provides an analysis of major product groups and of sheet products in detail.
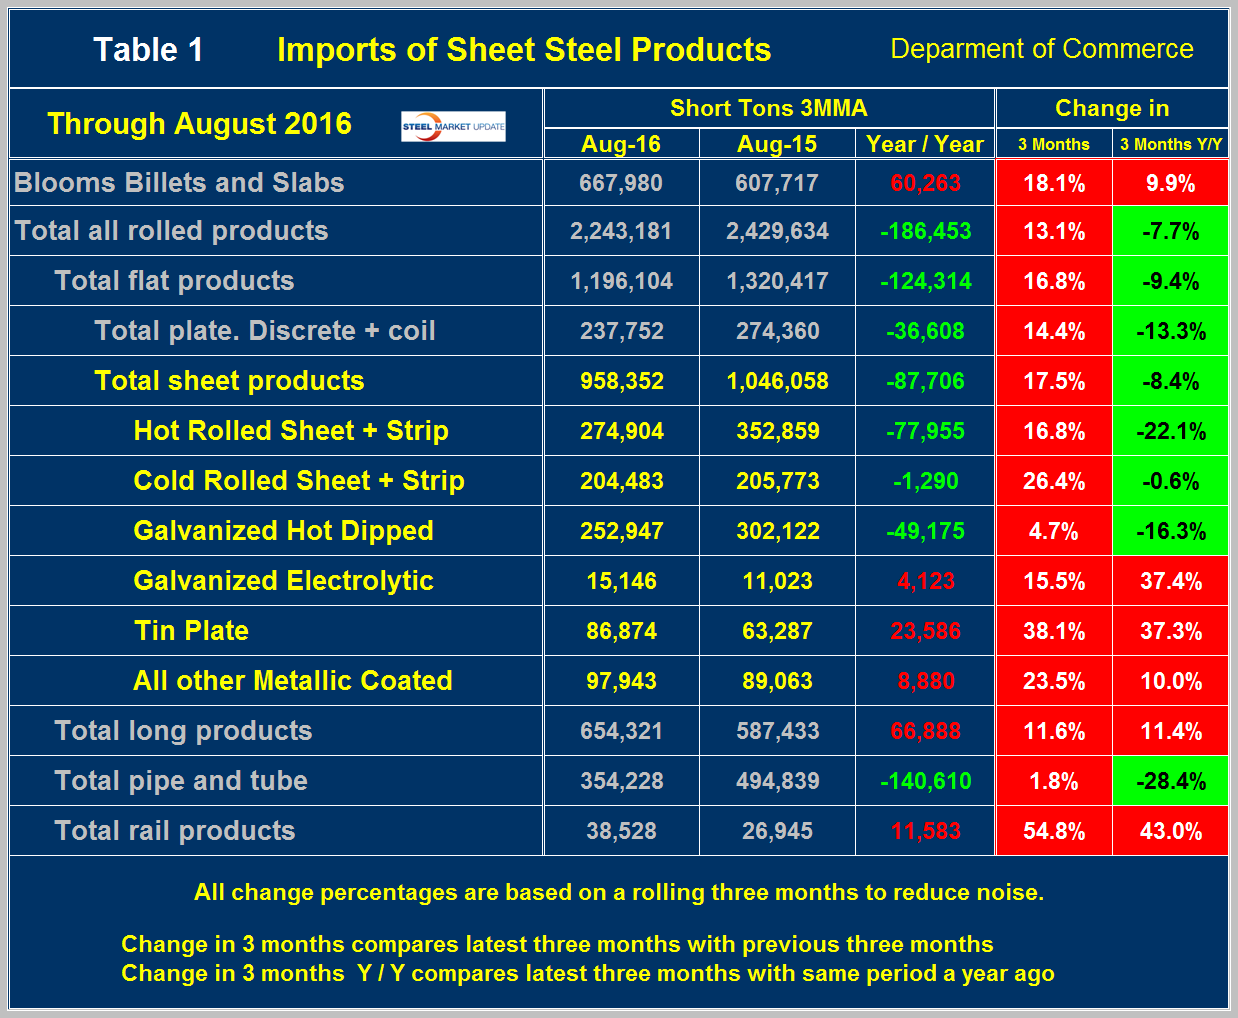
It compares the average monthly tonnage in the latest three months through August with both three months through May (3M/3M) and three months through August 2015 (Y/Y). On a Y/Y basis the total of all rolled products was down by 186,453 tons or 7.7 percent, as total sheet products were down by 8.4 percent. Tubulars were down by 28.4 percent. Semi-finished slabs, blooms and billets were up by 9.9 percent and long products were up by 11.4 percent. On a 3M/3M basis the situation was very different for many products and that column Table 1 is solid red meaning that imports increased for every product group in the June through August time frame compared to March through May. The total volume of hot worked products was up by 13.1 percent 3M/3M and in the sheet products ranged from an increase of 4.7 percent for HDG to 38.1 percent for tin plate.
Table 2 shows the same analysis for long products.
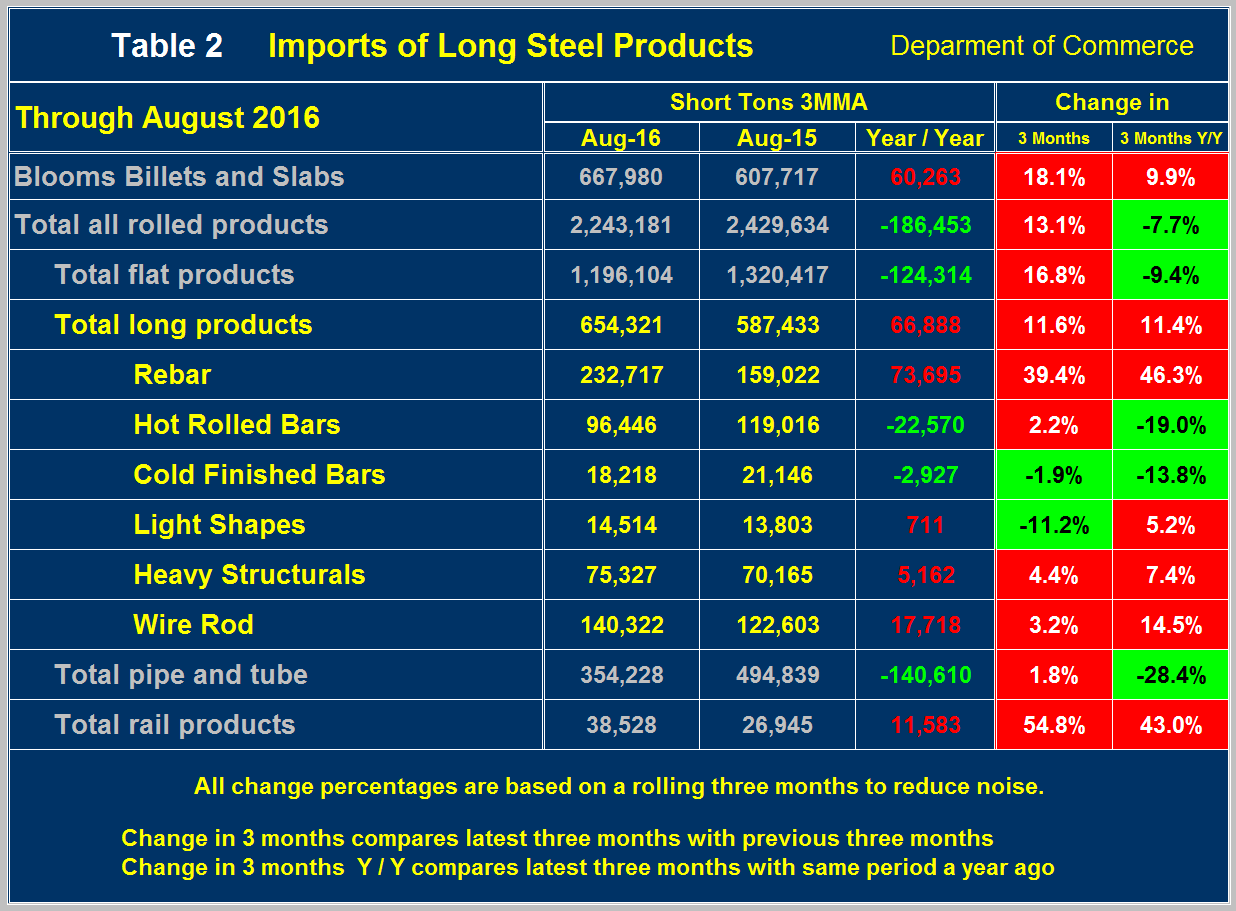
The total tonnage of long products was up by 66,888 tons per month Y/Y. Rebar was up by 73,695 tons and hot rolled bars were down by 22,570 tons. On a 3M/3M basis the total volume of long products increased by 11.6 percent led by rebar that was up by 39.4 percent.
Figure 3 shows the import market share of sheet and long products through July which is the latest data available for total steel supply.
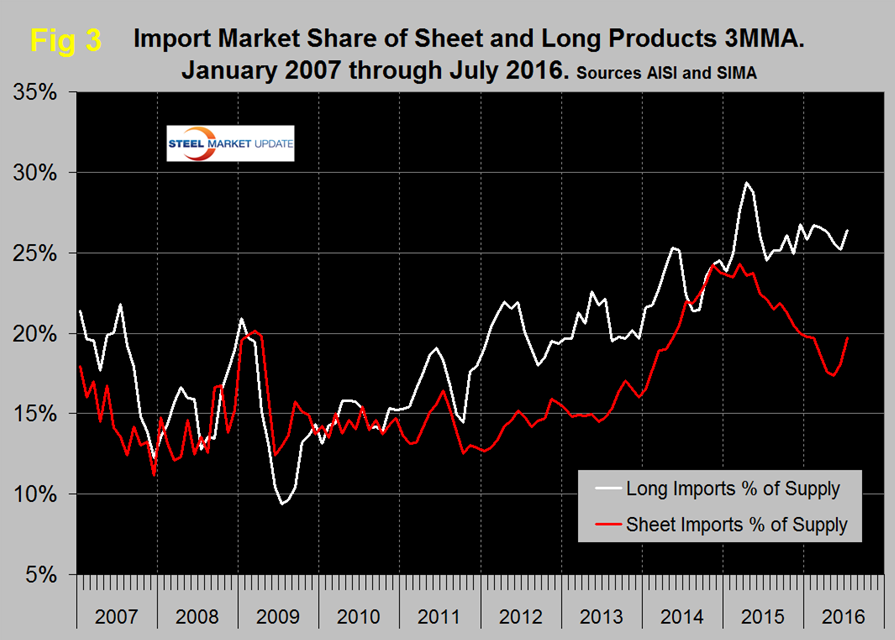
The import market share of sheet products peaked at 24.3 percent in March 2015 and has been less than 20 percent for each month of 2016. In July import share was 19.7 percent, up from a recent low of 17.4 percent in May. Long product import market share peaked at 29.4 in April 2015 but has only had two months since then below 25 percent. Import share of longs in July was 26.4 percent.
Net imports equals imports minus exports and our analysis is based on the final volumes through July. We regard this as an important look at the overall trade picture and its effect on demand at the mill level. Figure 4 shows that net sheet product imports on a 3MMA basis at 637,137 tons in July were down by 81,200 tons year over year and down by 527,900 tons YTD.
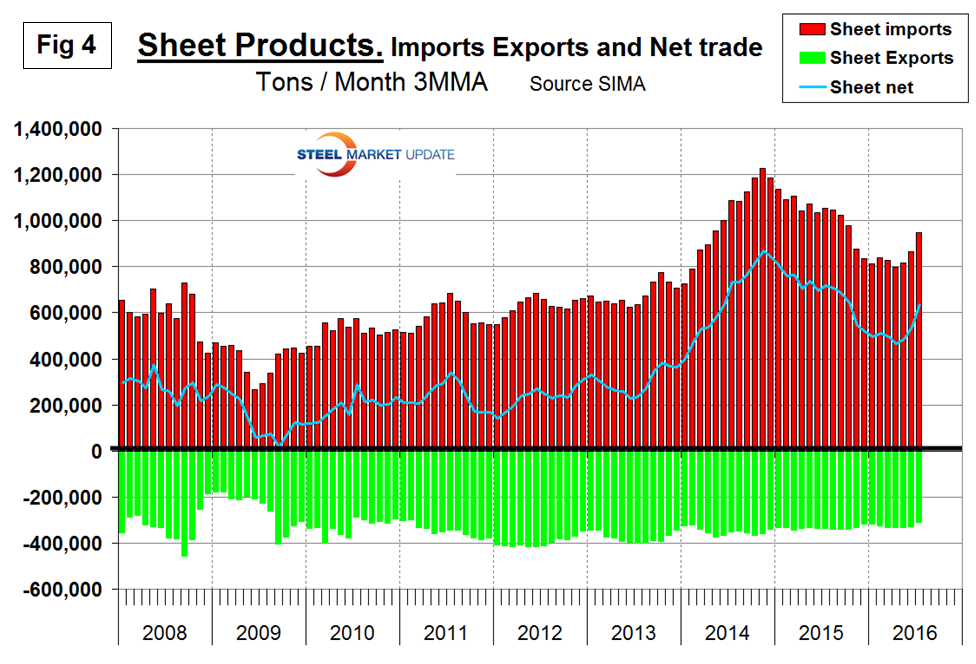
Compared to imports, exports have been relatively consistent for almost eight years. Net sheet steel imports are still high by historical standards. If the Fed raises interest rates later this month, the US $ will appreciate against the currencies of the steel trading nations and this in turn will tend to drive imports higher.
Explanation: The SMU publishes several import reports ranging from this very early look using licensed data to the very detailed analysis of final volumes by product, by district of entry and by source nation which is available on the premium member section of our web site. The early look, the latest of which you are reading now has been based on three month moving averages (3MMA) using the latest licensed data, either the preliminary or final data for the previous month and final data for earlier months. We recognize that the license data is subject to revisions but believe that by combining it with earlier months in this way gives a reasonably accurate assessment of volume trends by product as early as possible. We are more interested in direction than we are in absolute volumes at this stage. The main issue with the license data is that the month in which the tonnage arrives is often not the same month in which the license was recorded. In 2014 as a whole our data showed that the reported licensed tonnage of all carbon and low alloy products was 2.3 percent less than actually receipts, close enough we believe to confidently include licensed data in this current update. The discrepancy declined continuously during the course of the twelve month evaluation as a longer time period was considered.


