

Market Data

October 18, 2016
Currency Update for Steel Trading Nations
Written by Peter Wright
Please see the end of this report for an explanation of data sources. The Broad Index value of the US $ is reported several days in arrears by the Federal Reserve, the latest value we have was dated October 7th, Figure 1. The dollar has lacked direction since early May as traders have correctly anticipated a lack of action on rates by the Federal Reserve.
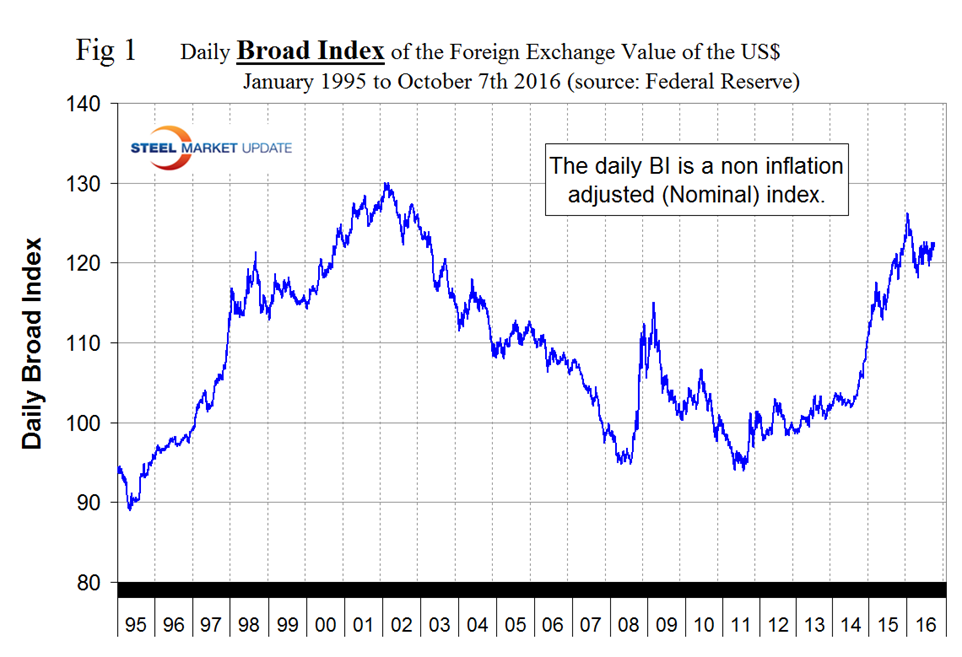
Table 1 shows the value of the US $ measured in the currencies of 16 steel and iron ore trading nations on October 16th, it reports the changes in one year, three months, one month and seven days for each currency and is color coded to indicate strengthening of the dollar in red and weakening in green.
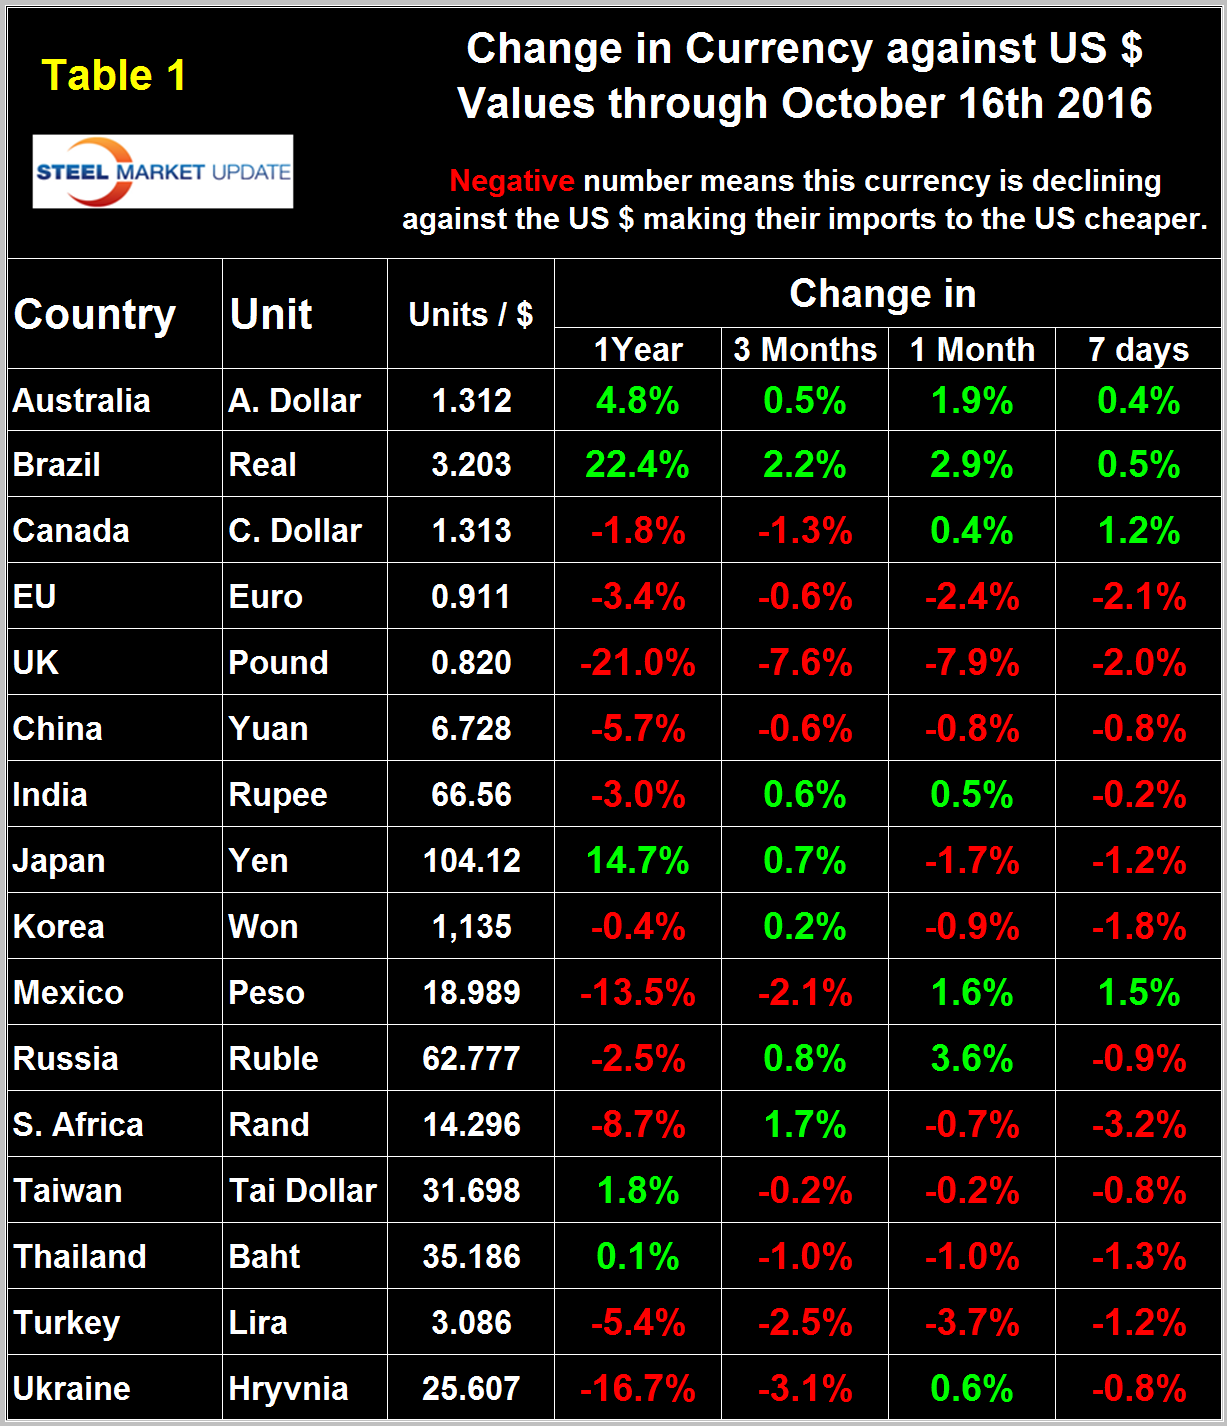
We regard strengthening of the US Dollar as negative and weakening as positive because the effect on net imports. An estimated 25 percent of the U.S. economy has some involvement in international trade therefore currency swings can have a large effects on the economy in general and of the steel industry in particular. At the one month level the dollar has strengthened against nine of the sixteen and weakened against the others. At the seven day level shown in Table 1 the dollar has strengthened against 10 of the 16. There is much agreement amongst analysts today that the Fed will raise rates in December therefore we can expect currency markets to react to that expectation at least until some new economic data arises to upset the assumption.
In each of these reports we comment on a few of the 16 steel trading currencies listed in Table 1. Charts for each of the 16 currencies listed in Table 1 are available through October 16th for any subscriber who requests them.
The Chinese Yuan (Renminbi)
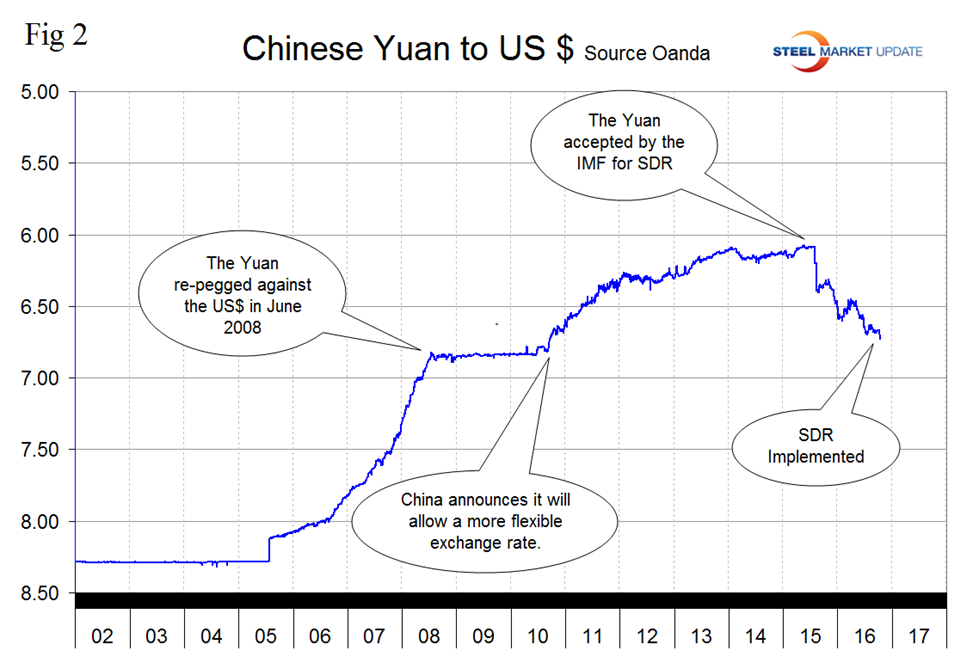
On September 29th the International Monetary Fund announced the launch of the new Special Drawing Right (SDR) valuation basket including the Chinese Renminbi (RMB), and the new currency amounts that will determine the value of the SDR during the new valuation period. Ms. Christine Lagarde, Managing Director of the IMF, stated: “The expansion of the SDR basket is an important and historic milestone for the SDR, the fund, because it is the first time since the adoption of the euro that a currency is added to the basket”. Effective October 1, 2016, the RMB will be included in the SDR basket as a fifth currency, along with the U.S. dollar, the euro, Japanese yen, and the British pound. The Board decided that the weights of each currency would be 41.73 percent for the U.S. dollar, 30.93 percent for the Euro, 10.92 percent for the Chinese yuan, 8.33 percent for the Japanese yen, and 8.09 percent for the Pound sterling. The Renminbi’s inclusion reflects the progress made in reforming China’s monetary, foreign exchange, and financial systems, and acknowledges the advances made in liberalizing and improving the infrastructure of its financial markets. The continuation and deepening of these efforts, with appropriate safeguards, will bring about a more robust international monetary and financial system, which in turn will support the growth and stability of China and the global economy.
The Chinese Yuan has declined by 5.7 percent against the US $ in the last year and by 0.8 percent in the last month (Figure 2).
The British Pound
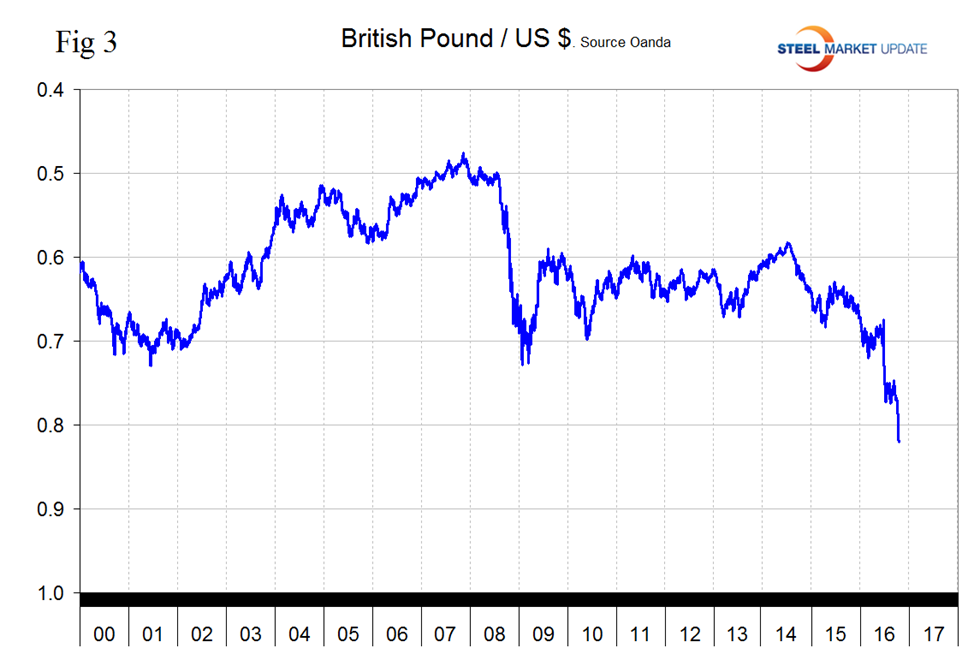
The British Pound continues to react badly to the Brexit referendum and on October 16th had declined to 1.2194 US dollars, down 21 percent in 12 months and 7.9 percent in one month (Figure 3).
Brazilian real, Australian dollar, Canadian dollar
Figures 4, 5 and 6 show the historical values of the Brazilian real, the Australian dollar and the Canadian dollar.
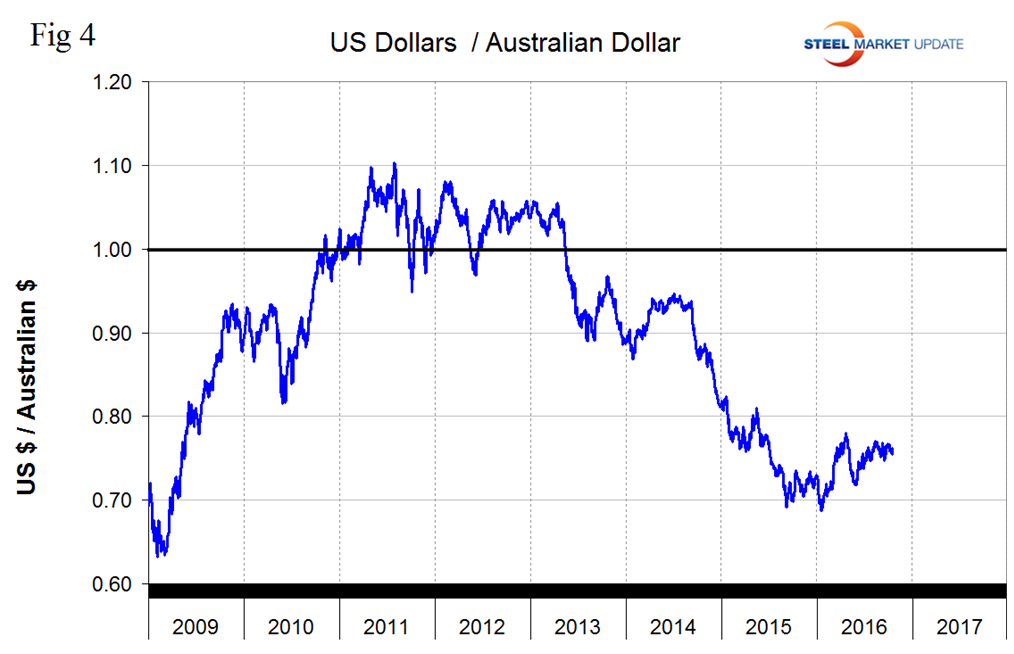
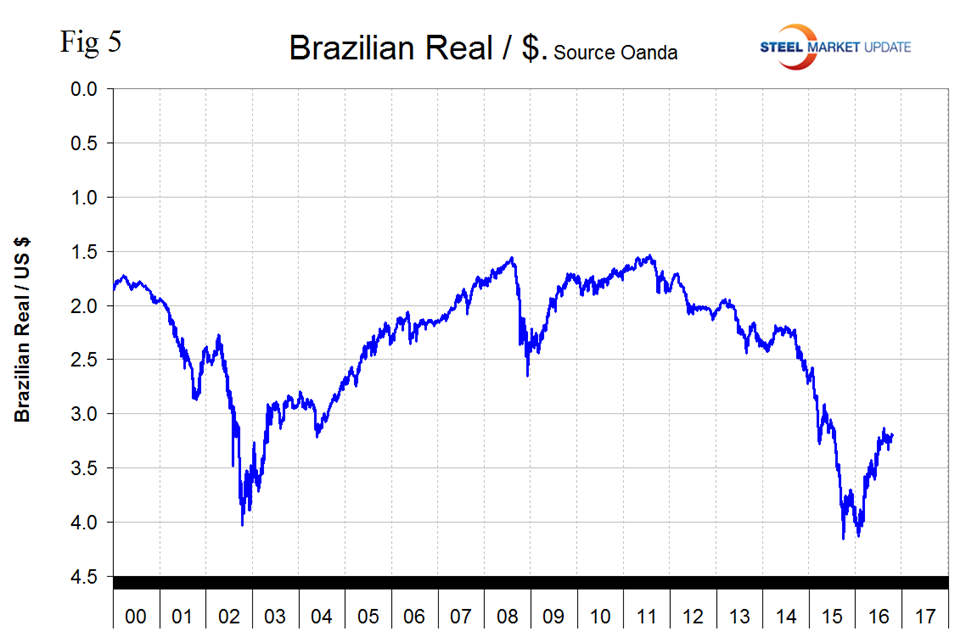
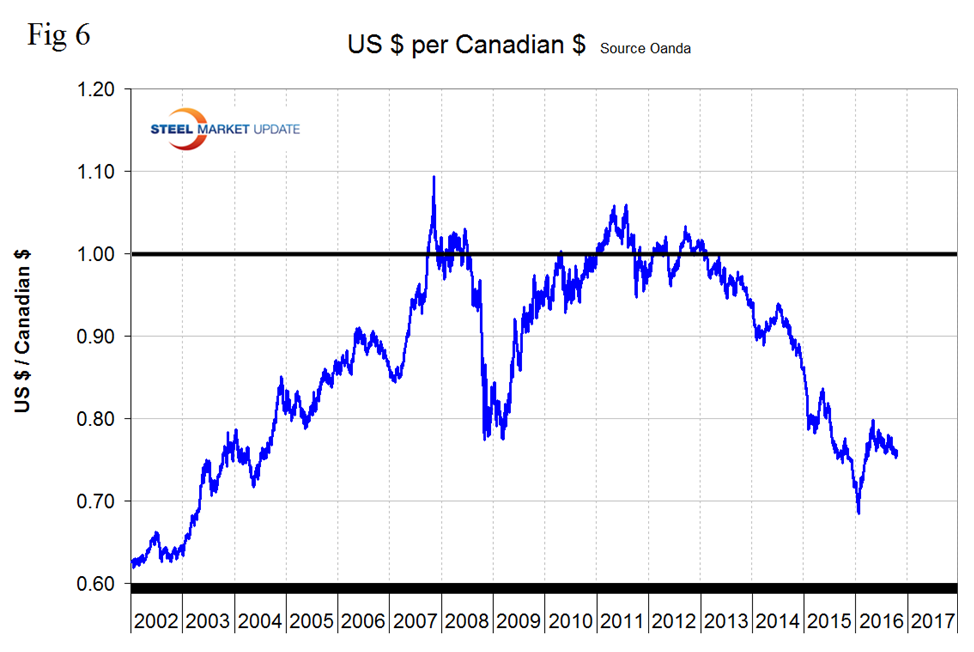
All three have strengthened this year but the Canadian dollar has been showing some weakness in the last four months. On October 16th Geoffrey Caveney wrote: “the Canadian economy is heavily tied to mineral resource extraction, from oil & gas to gold & silver to base metals, so it is no surprise that the value of the Canadian dollar declined significantly during the gold bear market and the oil price collapse. Note in particular the capitulation selloff in January and the sharp rally off of that low. Just like we saw with gold and oil, this strongly suggests January was the long-term bottom in the Canadian dollar. Breaking below $0.70 was simply too low, and the market reacted accordingly.) These thoughts also have relevance for the Brazilian real and the Australian dollar.
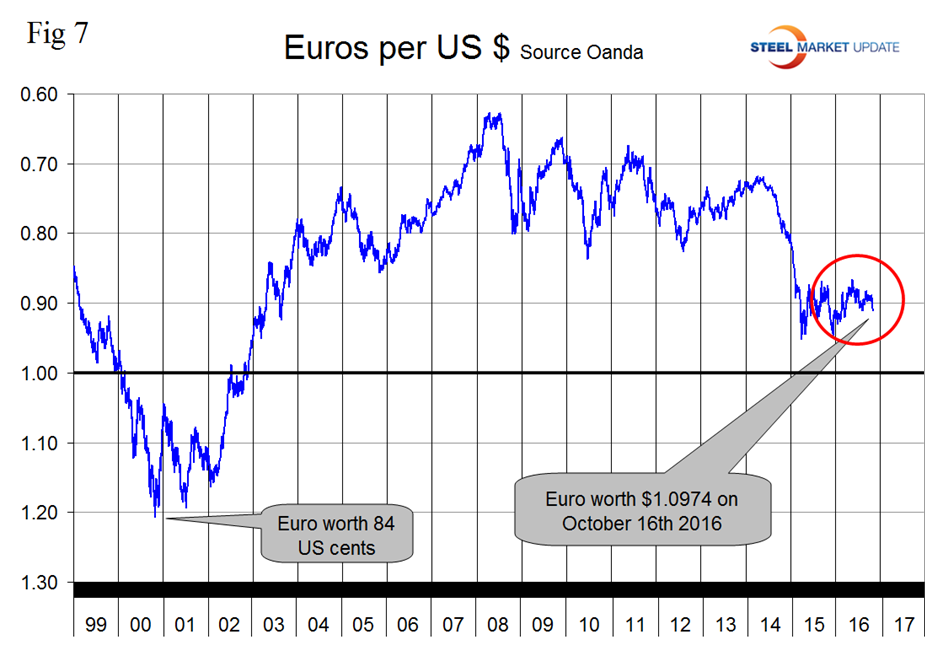
The Euro
The Euro has lacked direction since February and on October 16th was worth $1.0974, down by 2.4 percent in the last month but only by 0.6 percent in three months (Figure 7).
Explanation of Data Sources: The broad index is published by the Federal Reserve on both a daily and monthly basis. It is a weighted average of the foreign exchange values of the U.S. dollar against the currencies of a large group of major U.S. trading partners. The index weights, which change over time, are derived from U.S. export shares and from U.S. and foreign import shares. The data are noon buying rates in New York for cable transfers payable in the listed currencies. At SMU we use the historical exchange rates published in the Oanda Forex trading platform to track the currency value of the US $ against that of sixteen steel trading nations. Oanda operates within the guidelines of six major regulatory authorities around the world and provides access to over 70 currency pairs. Approximately $4 trillion US $ are traded every day on foreign exchange markets.


