

Prices

November 17, 2016
Flat, Long, and Semi-Finished Imports through October 2016
Written by Peter Wright
Licensed data for October was reported by the Steel Import Monitoring System of the US Commerce Department on November 8th. An explanation of the methodology that we at SMU use to analyze the trade data is given at the end of this piece.
![]() All volumes in this analysis are reported in short tons. Total rolled product licensed imports in the single month of October were 2,165,303 tons with a three month moving average (3MMA) of 2,161,695 tons. We prefer not to dwell on single months results because of the extreme variability that can occur in individual products. Unusually, this month they are about the same. In the comments below we use only three month moving averages because normally this presents a more representative picture.
All volumes in this analysis are reported in short tons. Total rolled product licensed imports in the single month of October were 2,165,303 tons with a three month moving average (3MMA) of 2,161,695 tons. We prefer not to dwell on single months results because of the extreme variability that can occur in individual products. Unusually, this month they are about the same. In the comments below we use only three month moving averages because normally this presents a more representative picture.
Figure 1 shows the 3MMA through October licensed tons of semi-finished, flat and long products since January 2004.
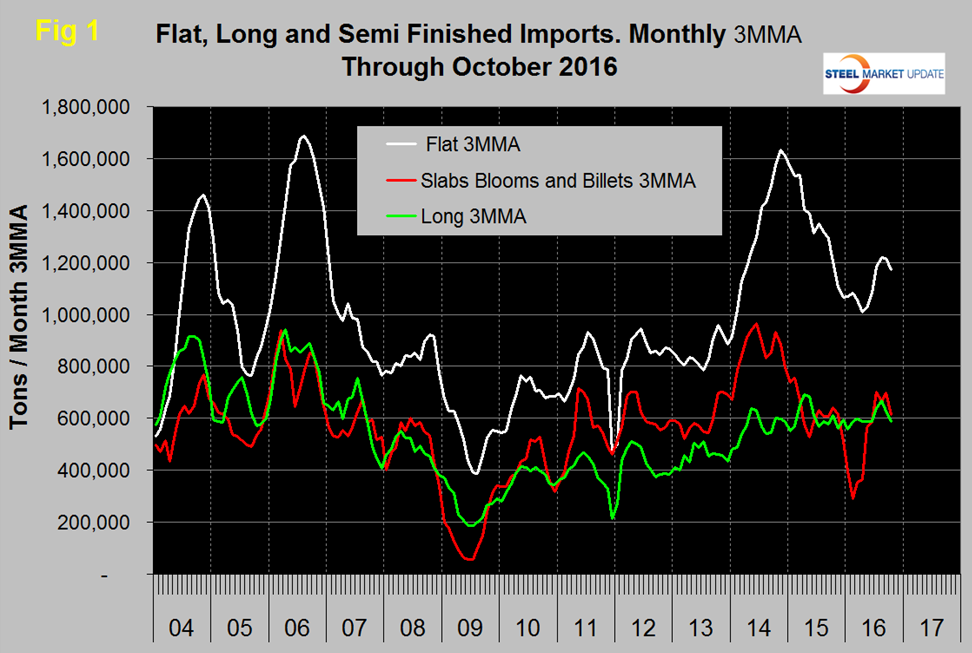
Imports of semi-finished in October were 526,478 tons with a three month moving average of 613,328 tons. February’s import volume of semis was an outlier, since then the volume has recovered to a level typical of 2015. “Flat” includes all hot and cold rolled sheet and strip plus all coated sheet products plus both discrete and coiled plate. The 3MMA of flat rolled imports peaked at 1,634,000 tons in November 2014, fell to 1,009,000 tons in April this year and has since climbed back to 1,172,674 tons. Long product imports have been range bound between 519,000 tons and 772,000 tons since March 2014 with no particular trend evident. In October the 3MMA of long product imports was 588,641 tons.
Figure 2 shows the 3MMA trend of sheet and strip products since January 2004.
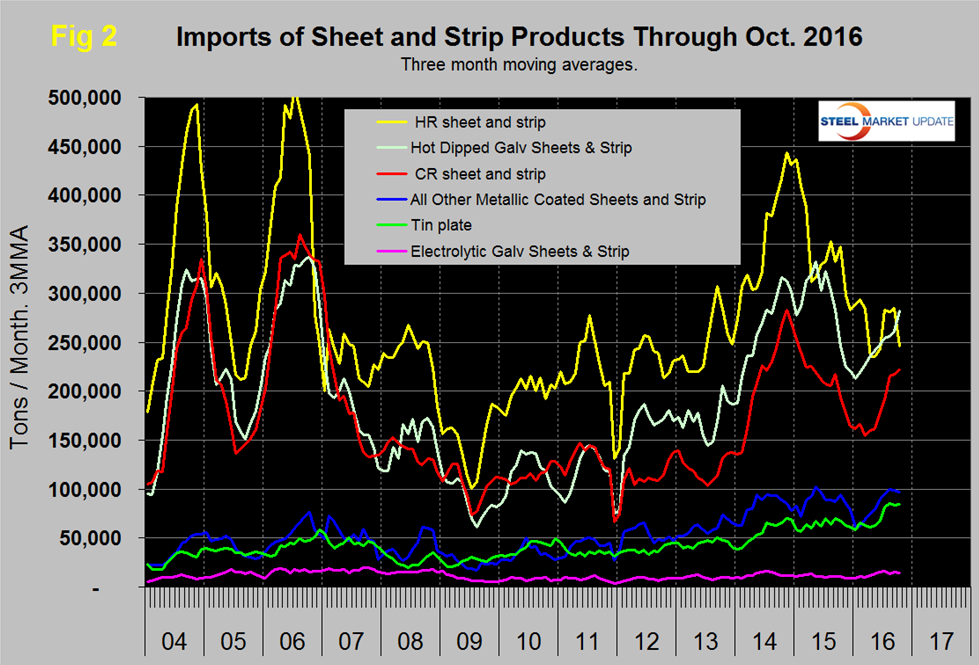
The total of these products was up by 2.4 percent in three months through October compared to three months through July. HRC was down sharply in October with increases in CRC and HDG. The other coated products were little changed. Electro-galvanized has been quite constant for over 2 years.
Table 1 provides an analysis of major product groups and of sheet products in detail.
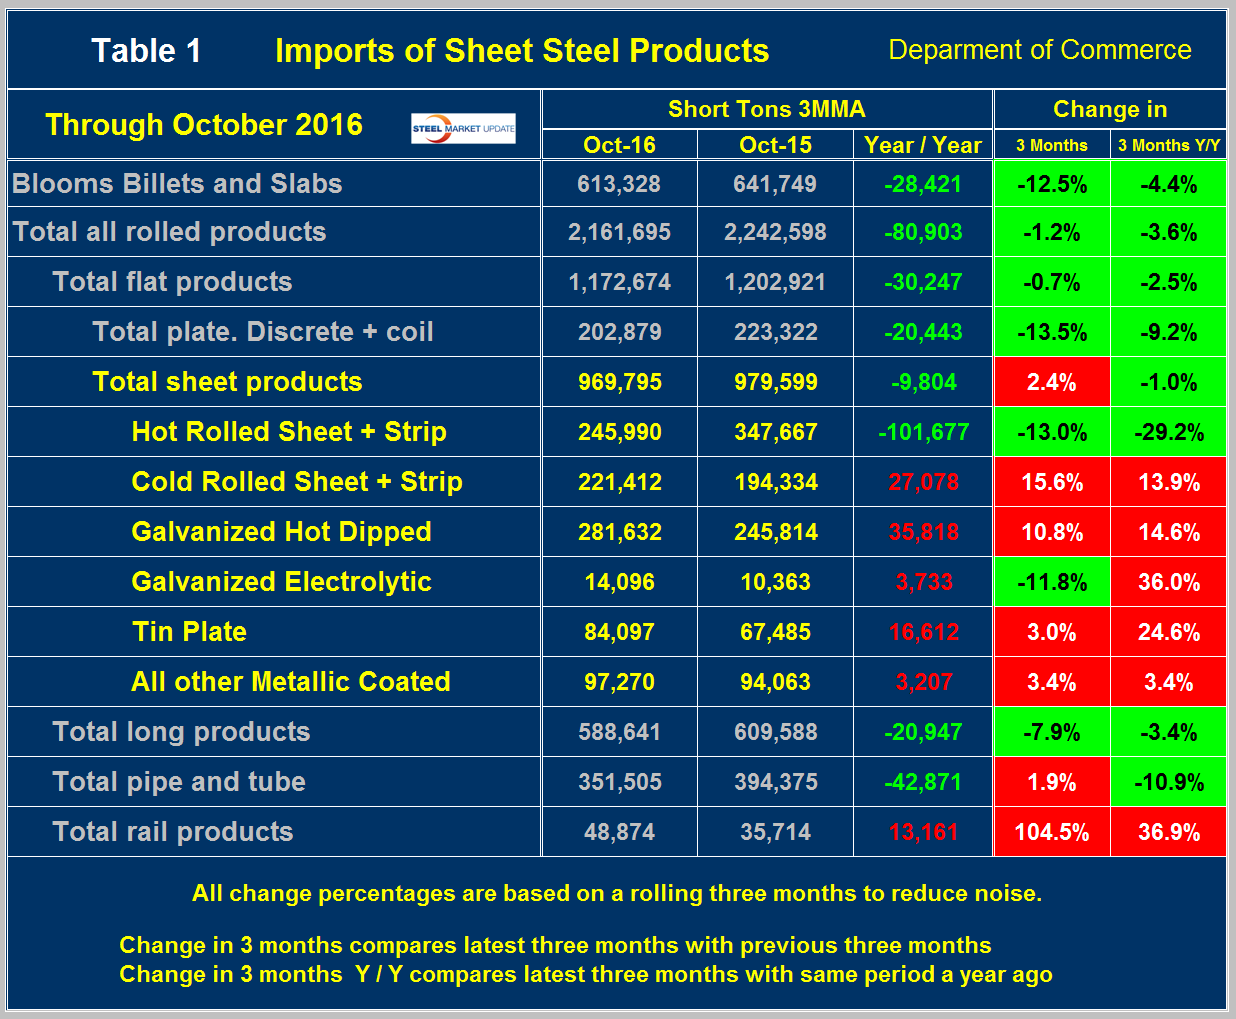
It compares the average monthly tonnage in the three months through October 2016 with both three months through July (3M/3M) and three months through October 2015 (Y/Y). On a Y/Y basis the total of all rolled products was down by 80,903 tons or 3.6 percent, as total sheet products were down by 1.0 percent. Tubulars were down by 10.9 percent. Semi-finished slabs, blooms and billets were down by 4.4 percent and long products were down by 3.4 percent. On a 3M/3M basis the situation was similar except total sheet products were up by 2.3 percent. The total volume of hot worked products was down by 1.2 percent, 3M/3M and within the sheet products ranged from an increase of 15.6 percent for cold rolled to a decrease of 11.8 percent for electro-galvanized. Of the big 3 sheet products 3M/3M, HRC was down by 13.0 percent, CRC was up by 15.6 percent and HDG was up by 10.8 percent.
Table 2 shows the same analysis for long products.
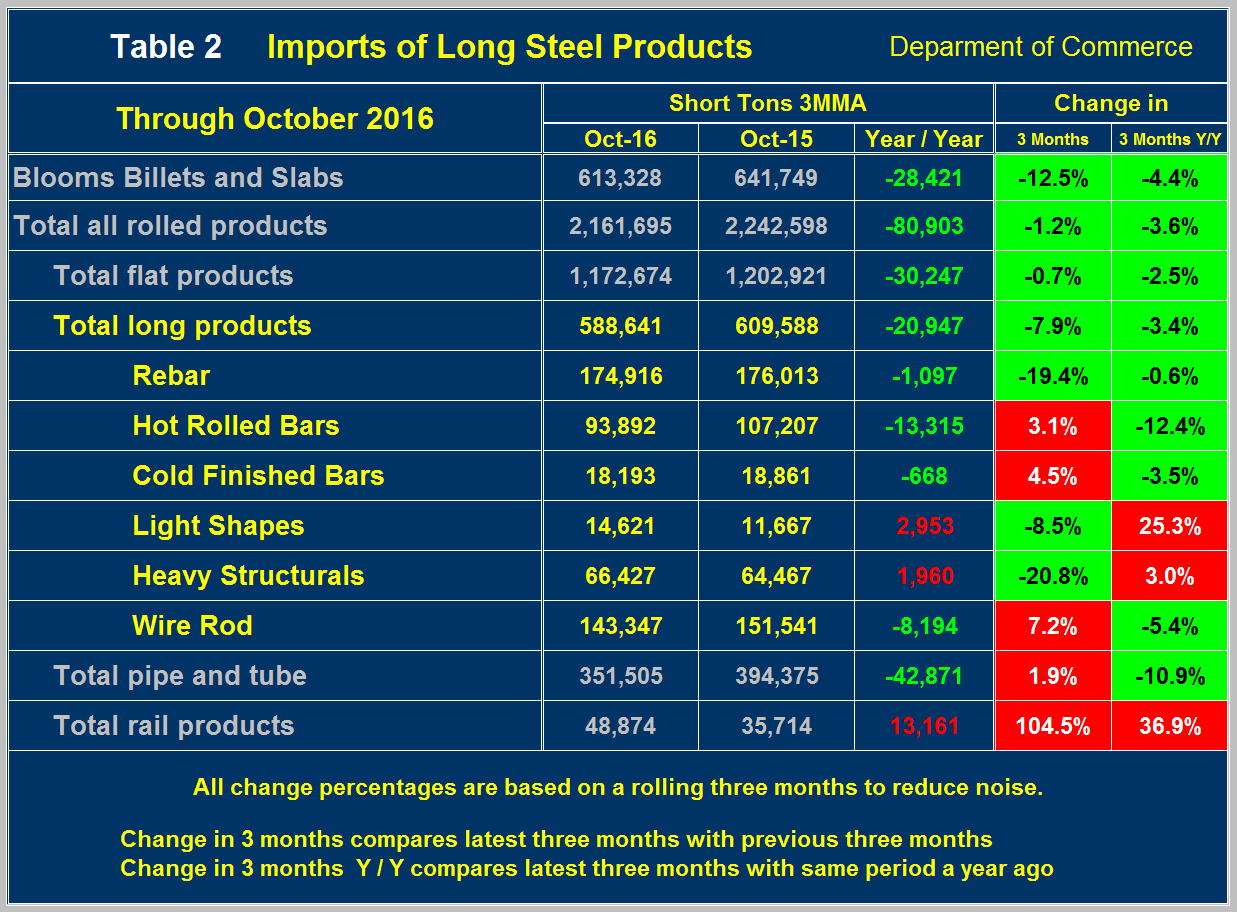
The total tonnage of long products was down by 20,947 tons per month Y/Y. Rebar was down by 19.4 percent and heavy structurals down by 20.8 percent which may be a reflection of the construction slowdown that we have reported in our CPIP analysis. On a 3M/3M basis the total volume of long products decreased by 7.9 percent.
Figure 3 shows the import market share of sheet and long products through September which is the latest data available for total steel supply.
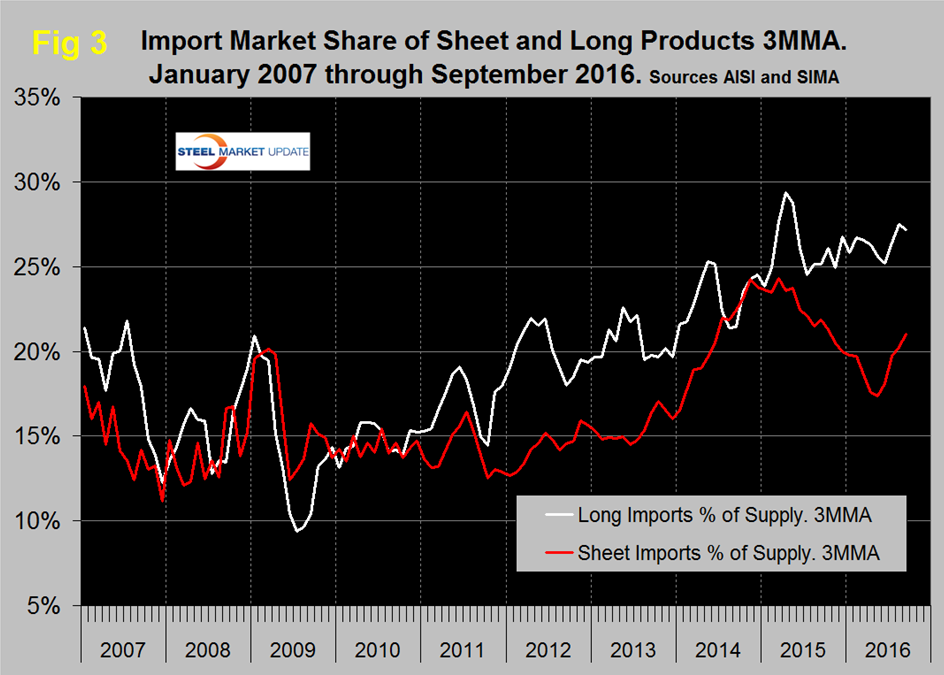
The import market share of sheet products peaked at 24.3 percent in March 2015 and was less than 20 percent for each month of 2016 until September when it bounced back to 21 percent on a 3MMA basis. Long product import market share peaked at 29.4 in April 2015 but has only had two months since then below 25 percent. Import share of longs in September was 27.2 percent.
Net imports equals imports minus exports and our analysis is based on the final volumes through September. We regard this as an important look at the overall trade picture and its effect on demand at the mill level. Figure 4 shows net sheet product imports on a 3MMA basis at 663,825 tons in September with an increasing trend in the last few months.
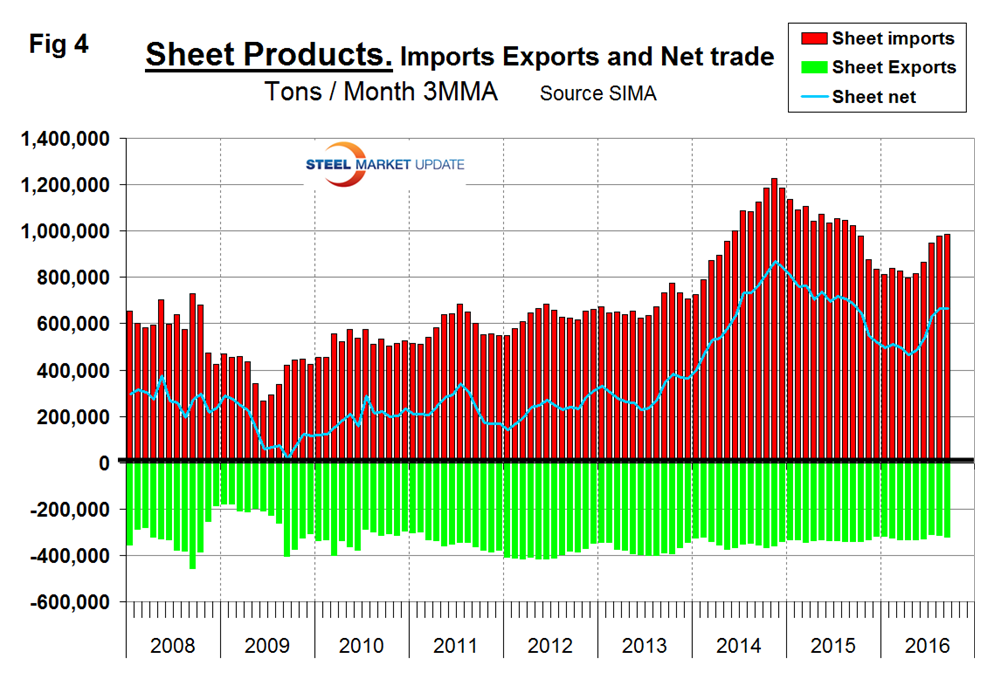
The total net was down by 769,703 tons YTD through September. Compared to imports, exports have been relatively consistent for almost eight years. Net sheet steel imports are still high by historical standards. If as expected the Fed raises interest rates in December, the US $ will appreciate against the currencies of the steel trading nations and this in turn will tend to drive imports higher and exports lower in 2017.
Explanation: The SMU publishes several import reports ranging from this very early look using licensed data to the very detailed analysis of final volumes by product, by district of entry and by source nation which is available on the premium member section of our web site. The early look, the latest of which you are reading now has been based on three month moving averages (3MMA) using the latest licensed data, either the preliminary or final data for the previous month and final data for earlier months. We recognize that the license data is subject to revisions but believe that by combining it with earlier months in this way gives a reasonably accurate assessment of volume trends by product as early as possible. We are more interested in direction than we are in absolute volumes at this stage. The main issue with the license data is that the month in which the tonnage arrives is not always the same month in which the license was recorded. In 2014 as a whole our data showed that the reported licensed tonnage of all carbon and low alloy products was 2.3 percent less than actually receipts, close enough we believe to confidently include licensed data in this current update. The discrepancy declined continuously during the course of the twelve month evaluation as a longer time period was considered.


