

Market Data

January 8, 2017
SMU Survey: 2017 Growth Expectations
Written by John Packard
During the first week of January Steel Market Update conducted our flat rolled steel market trends analysis. We invited 630 people associated with the flat rolled steel industry to participate. Of those responding 46 percent were manufacturers, 41 percent were steel service centers or wholesalers, 7 percent were steel mills, 4 percent steel trading companies and 2 percent were toll processors. We had 115 respondents to last week’s survey.
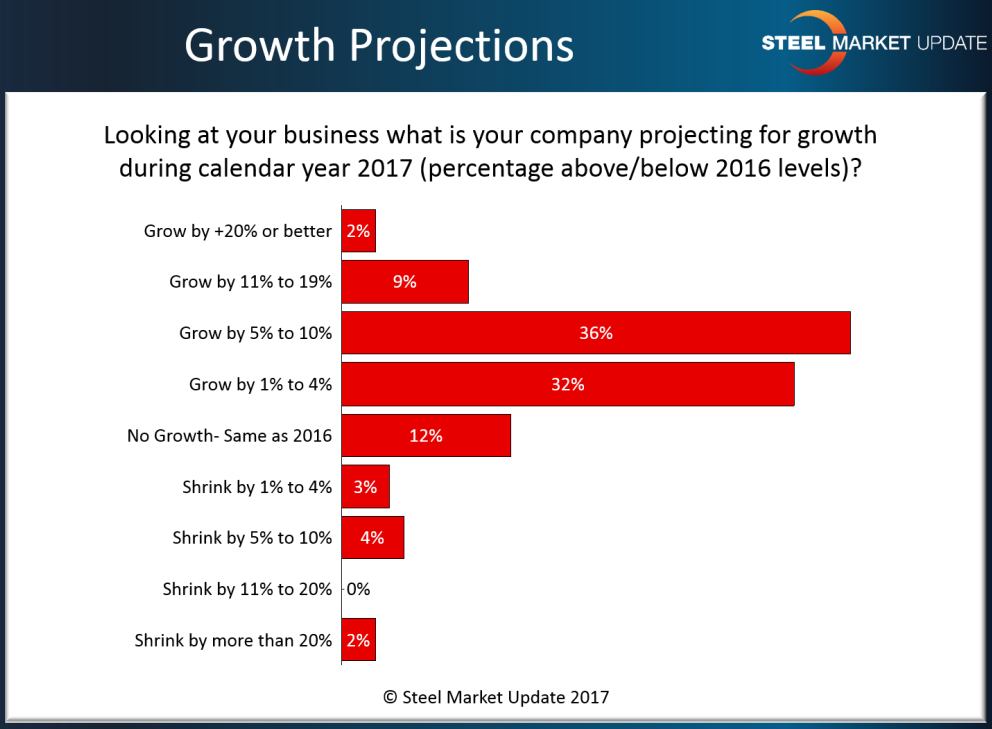
The question posed to all of our respondents was, “Looking at your business what is your company projecting for growth during calendar year 2017 (percentage above/below 2016 levels)?
As you can see, the majority of respondents are projecting growth, with 47 percent saying their growth will be 5 percent or greater. Only 9 percent of those responding reported their company as forecasting a slow-down in their business during 2017.
If you would like to see the entirety of our flat rolled steel market trends report you can do so as a Premium level member. We provide a Power Point presentation of the results on our website for our Premium members. The report from last week was placed on our website late last week shortly after we compiled the data collected.
If you would like information about upgrading your account from Executive to Premium please contact our offices at info@SteelMarketUpdate.com or by phone at 800-432-3475 (706-216-2140).


