

Prices

March 7, 2017
Global Trade of Cold Rolled Coil Through Q3 2016
Written by Peter Wright
We are continuing our investigation to quantify the players in the global steel trade of both hot rolled coil (HRC) and cold rolled coil (CRC). In our first report published in February we provided an overview for both products. Later last month we published a report describing the major players in the export and import of HRC. In this third report we have dug deeper into what is the US share of total global CRC imports, and who are the major players around the world. Global trade data is delayed by about two months from what is available for US imports. This is because countries collect their data at different rates and it is necessary to wait until it is all in before trying to perform an accurate analysis. These reports are intended to be a brief overview of a subject that is virtually unknown but which we at SMU believe steel industry executives should have some appreciation of. If any reader would like more specifics of the tonnage that is flowing from country A to county B we can provide it.
Let’s start with a recap of our initial observations. In the first three quarters of 2016 the global total volume of CRC was 30.0 million tons and excluding the inter EU volume was 22.9 million tons. As with HRC both tonnages have been trending up since Q1 2006 but CRC is trending up more slowly. Figure 1 shows the top eight exporters and in this case the US makes the list in 8th place. South Korea is in 2nd place to China with almost half the volume. Exports from Japan have been declining for almost five years. Exports from India have been increasing for over four years.
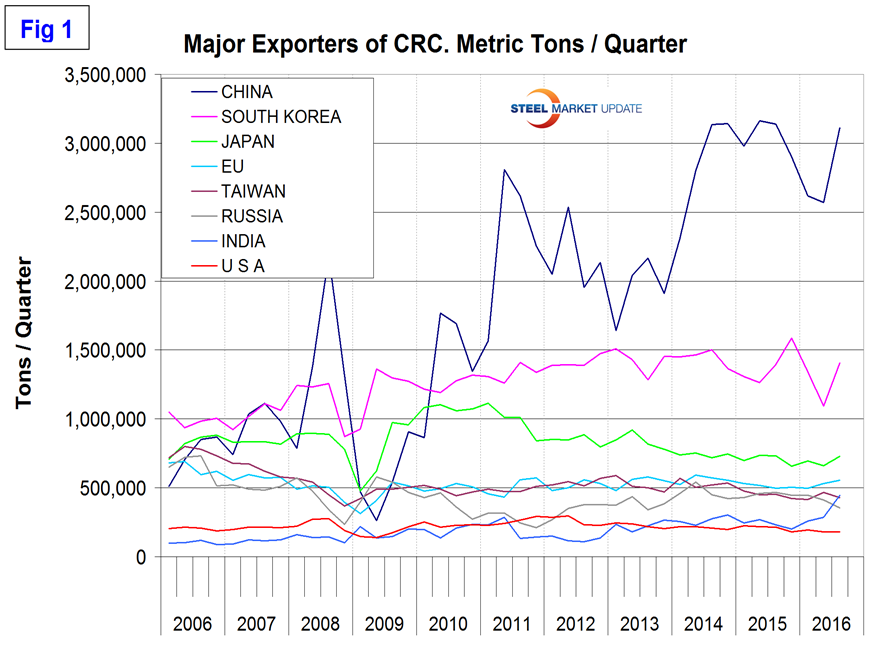
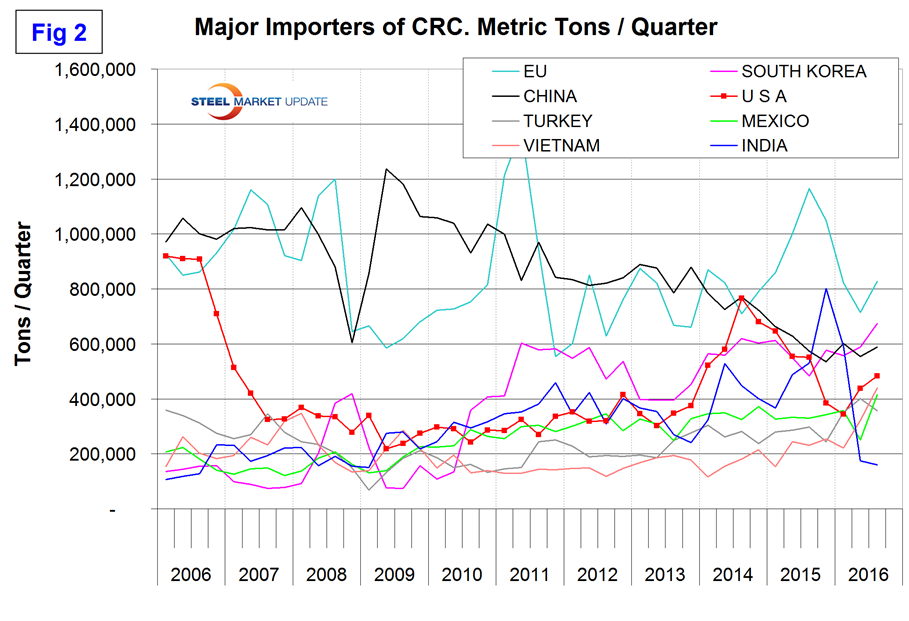
Figure 2 shows the top eight importing nations with the US as #4. The EU has the highest volume of imports and between Q4 2015 and Q3 2016, India fell from 2nd to 8th place. Note that South Korea makes the short list of both top importers and exporters.
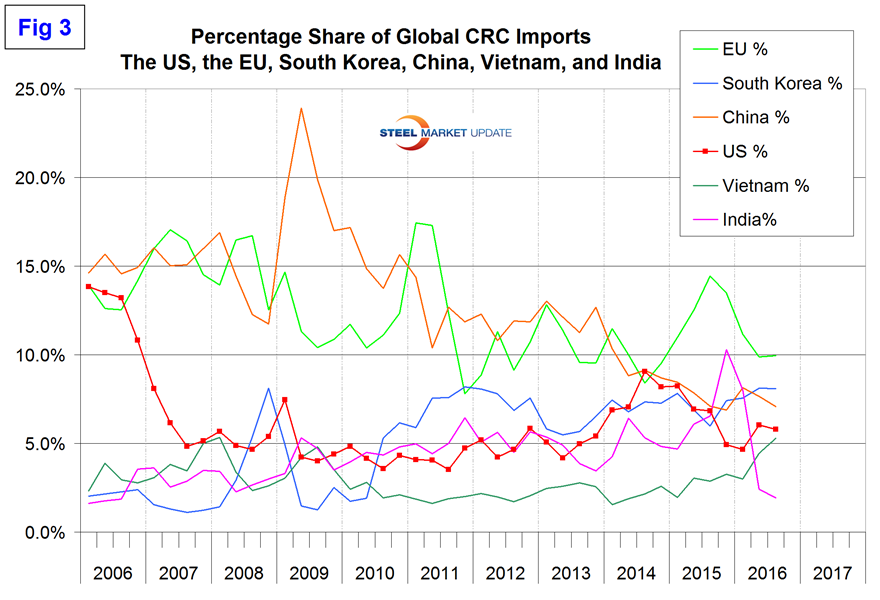
The United States imported 5.8 percent of the total volume of CRC that moved around the world in Q3 2016 and was in 4th place by tonnage. The US had a recent high of 9.1 percent in Q3 2014. In the first 3 quarters of 2016, the EU imported almost twice as much as the US. Both South Korea and China imported more than the US in each of the last four quarters reported, Figure 3. As with HRC, we find that the US is not (as has been frequently claimed), the most porous import market in the world.
China exported 8.3 million tons of CRC in the first three quarters of 2016. This was 37.4 percent of total global trade. In Figure 4 we see the major destinations for Chinese CRC exports by tonnage with South Korea in first place and the US having been shut out as a destination in 2016.
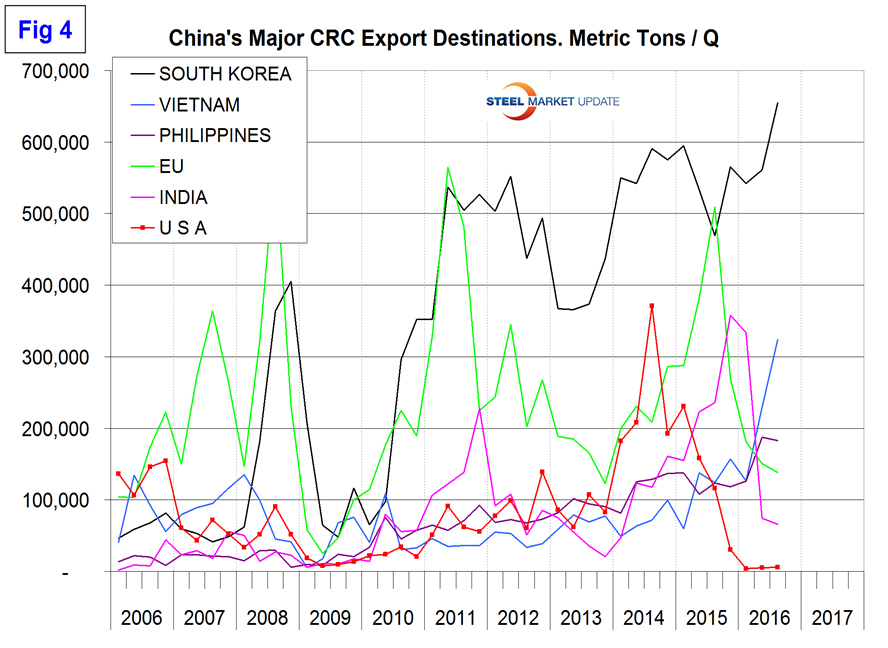
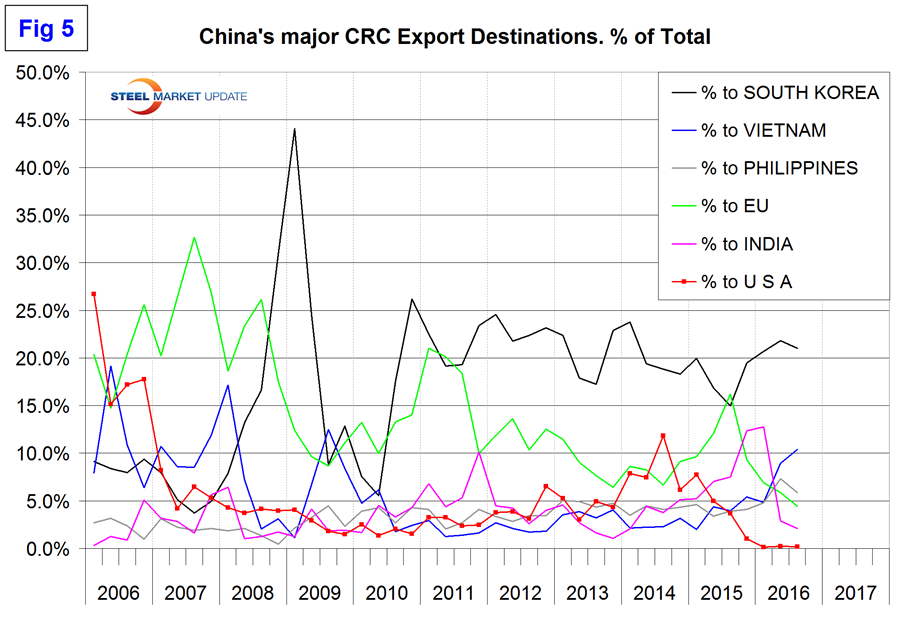
As with HRC, Vietnam has emerged as a major destination for Chinese CRC in 2015 and 2016. Figure 5 shows the major destination for Chinese CRC as a percentage which is interesting because it is quite different from the tonnage graph. The reason is that China has increasingly spread its tonnage around the world to smaller buyers as it maintained its tonnage to South Korea and increased it to Vietnam.
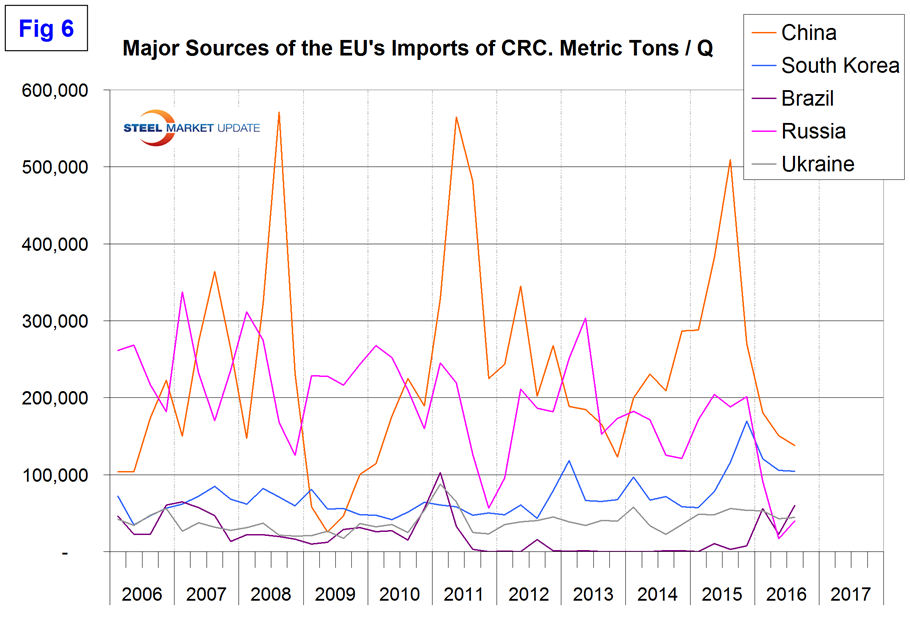
The EU is the largest importer of CRC as we saw in Figure 2. Major sources are China, South Korea, Brazil, Russia and Ukraine as shown in Figure 6.
Data for the fourth quarter of 2016 will be available late this month and we will analyze it for our premium subscribers. As with all the analyses that we perform at SMU we are interested in the relative magnitude of the individual elements and on any changes in direction that are occurring in those elements.


