

Market Data

March 19, 2017
Steel Mill Lead Times: Watching Changes Closely
Written by John Packard
Steel mill lead times are one of the key indicators of future direction of steel prices. Steel buyers must be aware of the amount of time it takes a supplier to produce and ship a new order. Lead times and balancing inventories go hand in hand. When lead times shrink, buyers can pull back on ordering steel. However, when lead times move out (extend) steel buyers have to increase purchases to make sure their company does not run out of product.
There are two ways to look at mill lead times. A buyer’s primary focus is on the suppliers being used or considered. They would review the lead times sheets (or verbal promises made by their salesperson) sent to them by their suppliers. The second way is to review the industry average which is produced by Steel Market Update during our flat rolled steel market trends analysis which is produced twice per month.
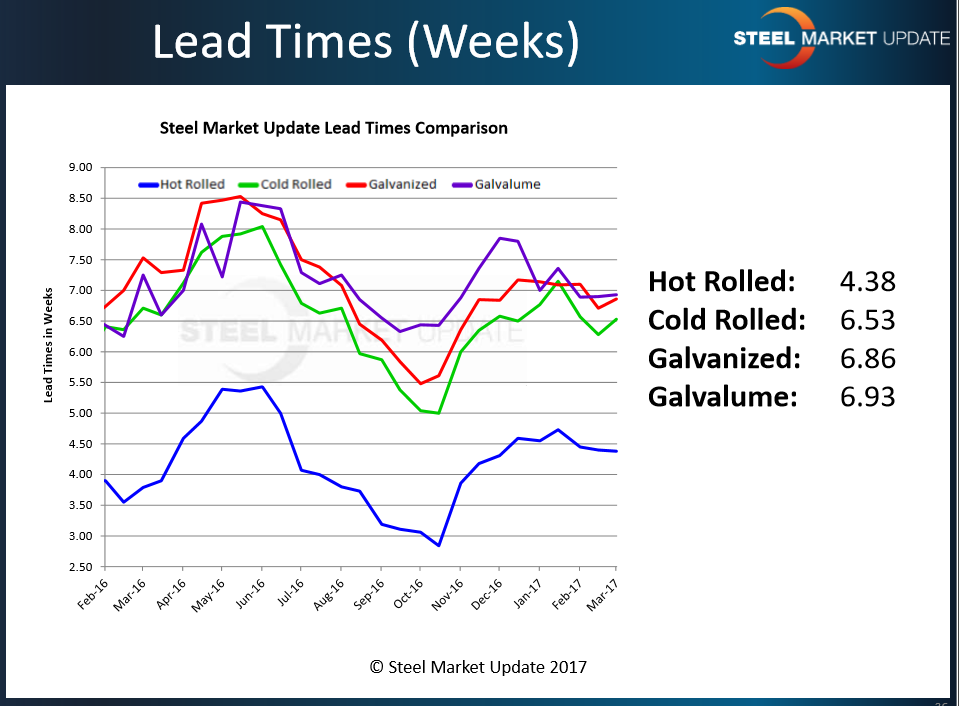
We last finished a market trends analysis on the 10th of March. At that time, we saw hot rolled averaging 4.38 weeks, cold rolled 6.53 weeks, galvanized 6.86 weeks and Galvalume 6.93 weeks. As we look at the graph produced at that time we found lead times as being the same or slightly lower than year ago levels. One year ago lead times were surging and prices were on the move (albeit from very low levels) before peaking during the first week of June at $635 per ton (last week SMU average on HRC was $645 per ton).
Individual Steel Mill Lead Times – Hot Rolled
Steel Market Update reviewed a number of the mill lead times to see how they compare with our average (shown above).
One of the longest lead times we have seen is the NLMK Portage, Indiana EAF mill which, as of the end of this past week, was quoting hot rolled lead times as being the week of May 1, 2017. This is a 7 week lead time – almost three weeks longer than the average crunched from our steel survey earlier this month (our next survey starts on Monday, March 20th).
Nucor Berkeley was not too far behind quoting hot rolled up to 54” as being the week ending April 22nd (as of Thursday of this past week) which is 5 weeks. Wider hot rolled was one week longer.
ArcelorMittal USA plants were quoting hot rolled “black” lead times out of their mills this past week at:
• Burns Harbor – April 16th – 5 weeks
• Indiana Harbor East – April 16th – 5 weeks
• Calvert (from slabs) – May 28th – 11 weeks
• Cleveland – May 15th – 9 weeks
• Riverdale – May 28th – 11 weeks
We are being told SDI Butler has most of their products on an “inquire” only basis.
Steel Market Update will begin collection of our late March flat rolled steel market trends analysis on Monday, March 20th. If you receive an invitation please take a moment to click on the link/button contained in the email and spend a few minutes answering our inquiries about lead times and a host of other items.


