

Market Data

April 19, 2017
Global Economic Outlook: IMF April 2017
Written by Peter Wright
We include here an unabridged statement from the IMF that was released on Thursday this week which forecasts economic growth for all regions and nations through 2022. The IMF raised its forecast for economic growth in the US in 2017 from 2.2 percent in the October forecast to 2.307 percent and in 2018 from 2.08 percent to 2.519 percent. Our SMU data analysis follows with comments about the future of global and domestic steel demand through 2022. We believe that an understanding of global influences is essential if we are to have any idea what the future of the US steel market will look like.
![]() World Economic Outlook April 2017 Gaining Momentum?
World Economic Outlook April 2017 Gaining Momentum?
Consistently good economic news since summer 2016 is starting to add up to a brightening global outlook. The economic upswing that we have expected for some time seems to be materializing: indeed, the World Economic Outlook (WEO) raises its projection for 2017 global growth to 3.5 percent, up from our recently forecast 3.4 percent. Our 2018 forecast holds steady, with the world economy’s growth set to rise to 3.6 percent next year. The expected growth improvements in 2017 and 2018 are broadly based, although growth remains tepid in many advanced economies, and commodity exporters continue to struggle.
At the same time, however, the upgrade to our 2017 forecast is modest, and longer-term potential growth rates remain subdued across the globe compared with past decades, especially in advanced economies. Moreover, while there is a chance growth will exceed expectations in the near term, significant downside risks continue to cloud the medium-term outlook, and indeed may have intensified since our last forecast. The gathering recovery remains vulnerable to a range of downside risks, which Chapter 1 of this WEO describes.
One salient threat is a turn toward protectionism, leading to trade warfare. Mainly in advanced economies, several factors—lower growth since the 2010–11 recovery from the global financial crisis, even slower growth of median incomes, and structural labor market disruptions—have generated political support for zero-sum policy approaches that could undermine international trading relationships, along with multilateral cooperation more generally.
An approach to international economic policy based on collaboration among countries took root after World War II and has evolved in scope and geographic breadth. This evolution has not always been smooth, as a history of financial and currency crises in recent decades attests, but the global economy’s coping mechanisms have until now proved resilient. One result has been a notable surge in growth in a number of emerging market and developing economies, some of which have reached high-income status. Chapter 2 of this report examines aspects of their convergence toward higher incomes.
Richer countries have continued to grow as well, but with less impressive income gains over the past 10 years when compared with previous decades, and certainly when compared with the more successful emerging market and developing economies. It is not surprising, therefore, that attitudes about international trade’s effects on jobs and wages, as measured by leading surveys, tend to be more positive in poorer economies.
These findings may have less to do with the overall growth disparity between rich and poor countries than with the failure of growth gains in rich economies to substantially reach those in the lower parts of the income distribution in recent decades. Inequality remains substantial within poorer countries, but with more room for catch-up and higher growth under the right policies, they have been able to lift substantially the incomes of even their poorest citizens. International trade has been a key element in those success stories.
Global trends in inequality are related to trade, but owe much, and in many countries more, to technology changes—insofar as one can conceptually separate technological advance (which facilitates trade) from trade itself (which spreads technological know-how). Chapter 3 of this report explores how the forces of technology and trade have tended to lower labor’s share of national income in many countries. A fall in labor’s GDP share could, in theory, be a benign response to economic developments that raise workers’ real incomes—for example, fast productivity growth that benefits capital even more than labor. However, where a fall in labor’s share coincides with stagnant median incomes and a worsening income distribution, as has been the case in a number of advanced economies, political pressures to roll back economic integration with trading partners can follow.
Capitulating to those pressures would result in a self-inflicted wound, leading to higher prices for consumers and businesses, lower productivity, and therefore, lower overall real income for households. Governments should instead follow trade policies consistent with maximum productivity, supplementing those with other policies that better distribute the gains from foreign trade internally, improve the skills and adaptability of their workforces, and smooth the process of adjustment for those adversely affected by the need for economic reallocation. Unfortunately, governments often find it harder to make such domestic improvements than to restrict trade. But they need to be aware that the gains that such an approach may yield for some at home come at the expense of others in the domestic economy in addition to foreign trade partners. Even the sectoral gains from curbing cross-border economic integration disappear, and losses worsen, when trade partners retaliate in kind.
Policymakers instead must do the hard work of investing in their economies, especially in people, to create greater resilience to a host of potential and ongoing structural changes—including the changing modalities of globalization. Useful reforms can focus on active labor market policies, greater tax progressivity where helpful, more effective investment in education, and changes to housing and credit markets that facilitate worker mobility.
Many of these policies not only ease economic adjustment, but they also raise potential output over the longer term. They are key components of the set of monetary, fiscal, structural, and financial sector policies that will strengthen and secure the recovery over time.
The global economy seems to be gaining momentum—we could be at a turning point. But even as things look up, the post–World War II system of international economic relations is under severe strain despite the aggregate benefits it has delivered—and precisely because growth and the resulting economic adjustments have too often entailed unequal rewards and costs within countries. Policy must address these disparities head-on to ensure the stability of an open, collaborative trading system that benefits all. Maurice Obstfeld, Economic Counselor
SMU Data Analysis
Figure 1 shows the growth of global GDP since 1970 with this month’s IMF forecast through 2022.
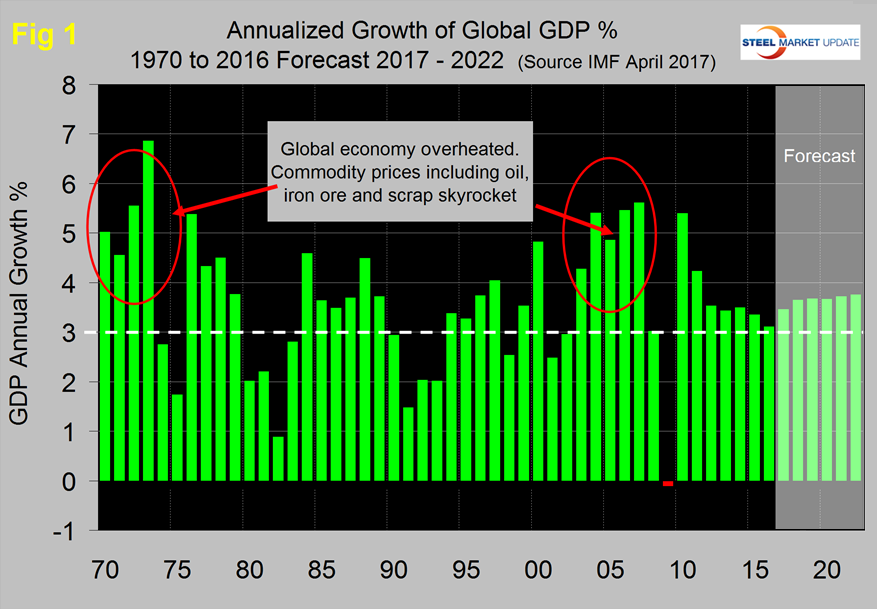
We have highlighted the periods of the early seventies and the mid-2000s when the commodity bubbles prevalent at those times were driven by unusually high and sustained global growth. The collapse of the commodity bubble in the last decade coincided with the US banking and housing crisis setting up the perfect storm. After the rebound in 2010 global growth declined through 2016 and is now forecast to expand slowly through 2022. Prior to the 2001 recession, the US held its own in the economic growth stakes but between 2001 and 2008, growth in the US averaged 1.84 percent less per year than the growth of the global economy as a whole (Figure 2).
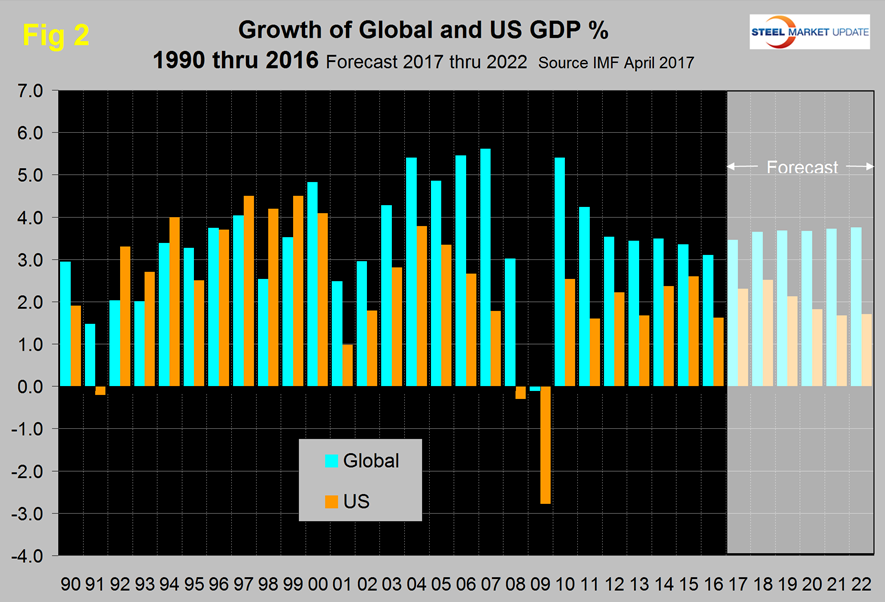
In the years 2011 through 2015 the gap narrowed to 0.76 percent. The difference is forecast to widen to 2.05 percent as global growth climbs back to 3.76 in 2022. The US has outperformed the Eurozone in every year since 2008 and is forecast to continue to do so through 2022 (Figure 3) though the gap is expected to close.
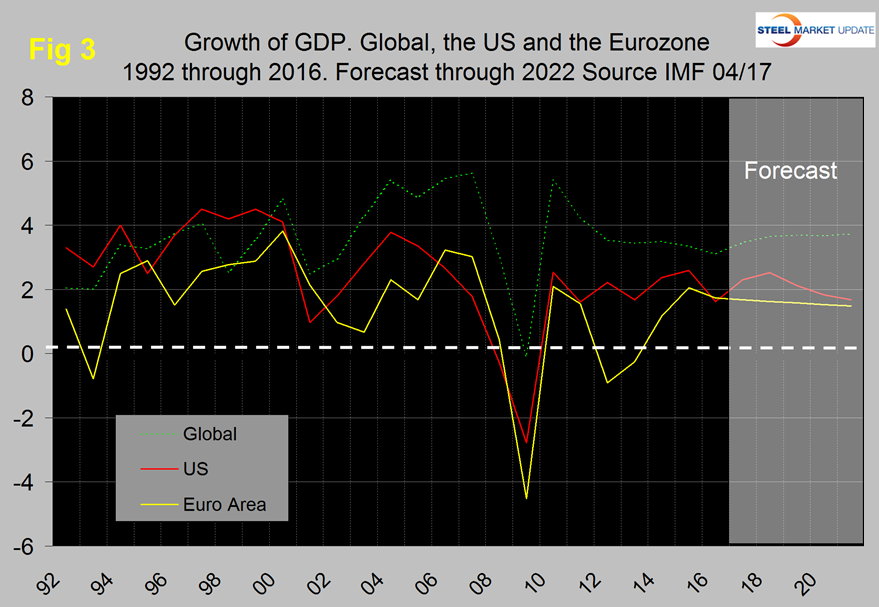
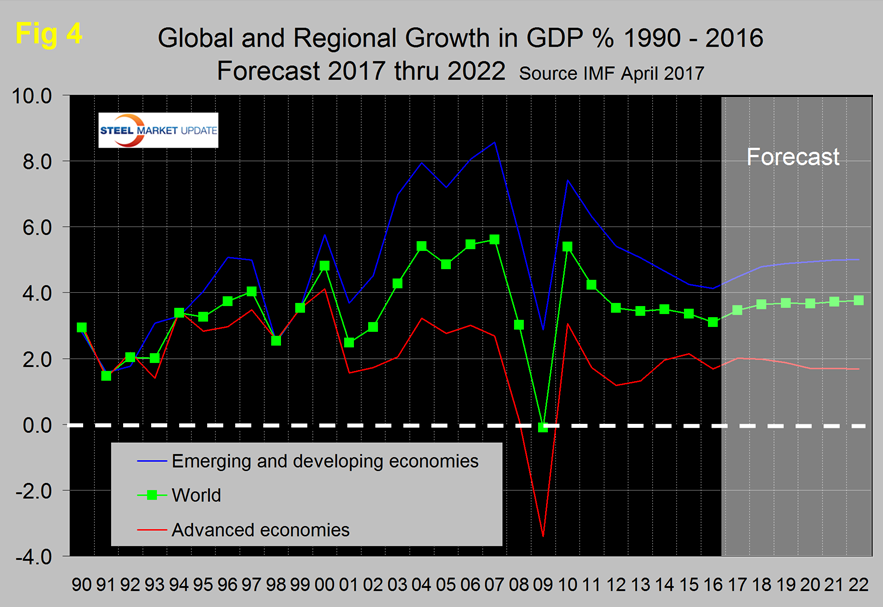
Figure 4 shows the growth comparison between emerging and developing economies and the advanced economies, that gap is projected to widen through 2022.
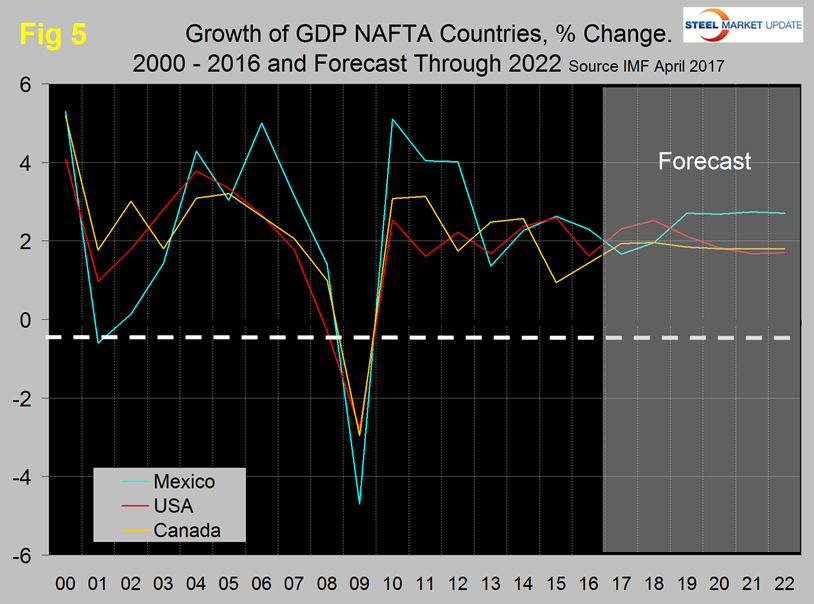
Within NAFTA, the US is forecast to have the highest rate of growth in 2017 and 2018 with Mexico taking over the lead in 2019. Canada performed relatively badly in 2015 and is expected to lag behind the US until 2020 (Figure 5).
There is a relationship between the growth of GDP and steel demand at both the international and national level which also extends to other commodities such as cement. There are two interesting aspects to this relationship. First the cyclical change in steel demand is vastly more volatile than the change in GDP which we attribute to the inventory response throughout the supply chain. Secondly as discovered by our friends at “Steel Guru” 1 percent growth in GDP does not result in 1 percent growth in steel demand. At the global level it takes a 2.8 percent increase in GDP to get any increase in steel demand (Figure 6).
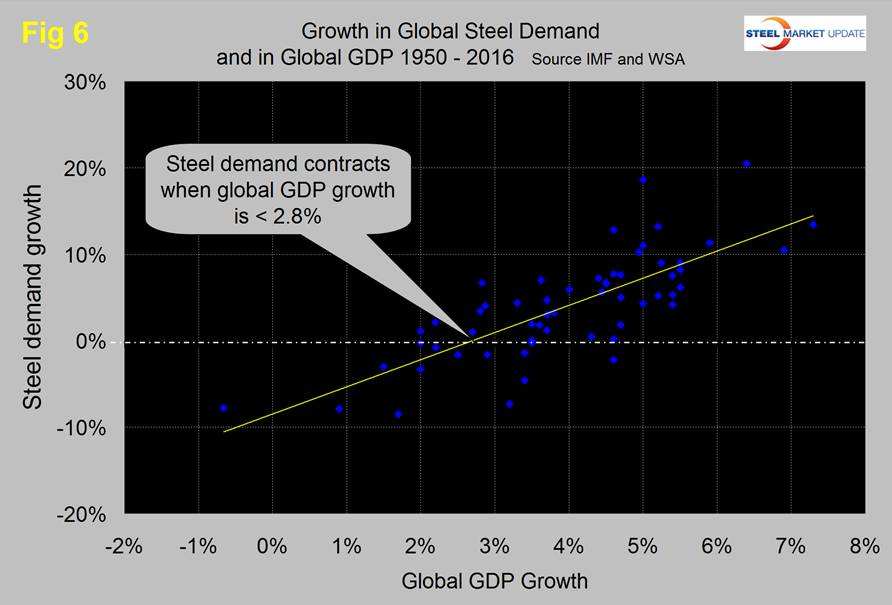
This is a long term average over a period of 65 years and based on the added volatility of steel can be a predictor of the immediate future. For example after the disastrous decline in steel demand in 2009 there was no doubt that a huge cyclical rebound would occur as inventory managers throughout the world began to react to the economic recovery. If the IMF forecast proves to be correct then the growth in global steel demand will improve to around 3 percent annually through 2022. In the US steel market it requires about 2.2 percent growth in GDP to generate growth in steel demand therefore if current forecasts prove to be correct regarding the US economy we can expect steel demand to be relatively flat for the next few years.


