Prices
April 22, 2017
Galvanized Import Analysis 2009-YTD
Written by John Packard
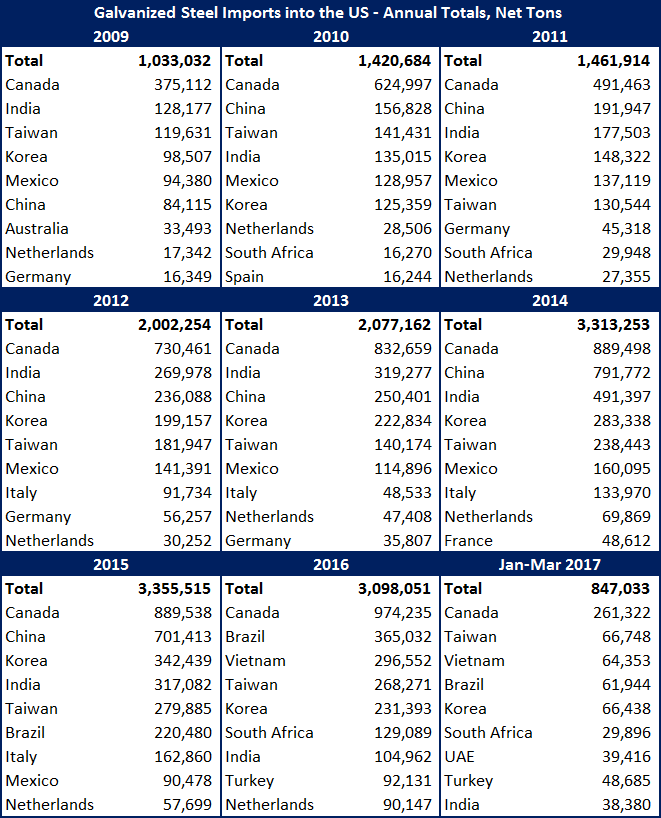
Steel Market Update (SMU) has been going through the import data as presented by the U.S. Department of Commerce going back to 2009 (Great Recession) and looking at the market as we came out of the Great Recession. In 2009, 2010 and 2011 galvanized imports were 1 to 1.5 million net tons. In 2012 and 2013 the tonnage barely broke through 2 million tons. Since then, imports of hot dipped galvanized have exceeded 3 million net tons with the high being 3,355,515 net tons in 2015 resulting in the AD/CVD suits which were filed on CORE (corrosion resistant products) in June 2015.
In 2015 the top 9 exporting countries were: Canada, China, Korea, India, Taiwan, Brazil, Italy, Mexico and the Netherlands.
So far 2017 is on pace to meet, or exceed, the 2015 3.3 million ton number. The top 9 countries now are: Canada, Taiwan, Vietnam, Brazil, Korea, South Africa, UAE, Turkey and India.