

Market Data

April 24, 2017
China’s Economic Statistics and Steel Production through Q1 2017
Written by Peter Wright
Once each quarter we publish the official statistics for Chinese GDP, industrial production, consumer price inflation and fixed asset investment. Currently available data is through the first quarter except for CPI which is through February. Many analysts don’t believe these Party self-serving figures but we include them in our reports because of the importance of China in the global steel scene and these numbers are all there is.
Figure 1 shows published data for the growth of GDP, industrial production and consumer prices through the first quarter of 2017. The GDP and industrial production portions of this graph are three month moving averages.
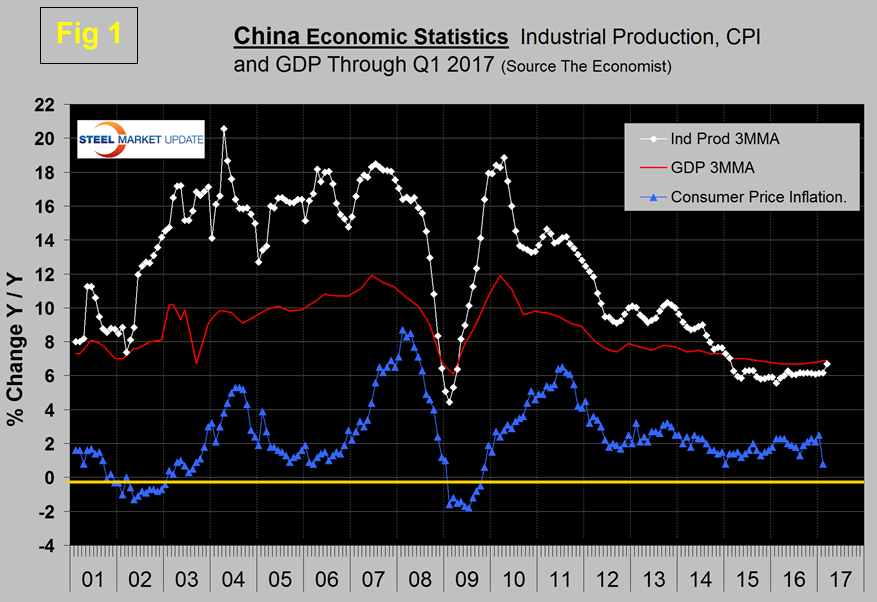
The growth of GDP was 6.9 percent in Q1, up from 6.8 percent in Q4 and from 6.7 percent in the first three quarters of 2016. This slight increase should be seen in the context of the decline since the peak of 11.9 percent in Q1 2010. Consumer price inflation averaged 1.44 percent in 2015, 2.0 percent in 2016 and fell to 0.8 percent y/y in February pulled down by lower food prices during the Lunar New Year. Core inflation remains relatively stable. The growth of industrial production rose to 6.7 percent in March as a 3MMA after having been little changed since March 2015.
On April 17th Economy.com wrote: “China’s economy performed better than expected in Q1 2017, accelerating for a second consecutive quarter. The cyclical upturn remains intact. The housing market remains buoyant, and this is helping property developers sell inventories and giving them reason to increase investment. Strong credit growth has helped in this regard, and the PBoC remains vigilant on the risks related to mortgage lending. Exports are also boosting manufacturing output, especially for high tech products. Global consumer tech demand continues to improve, thanks to the growing U.S. economy. China’s economy is in the midst of a cyclical upswing”. Higher construction activity thanks to the buoyant housing market is boosting demand for cement and steel. The strong housing market is driving a lot of the commodity price surge.
Figure 2 shows the growth of fixed asset investment y/y. In March FAI grew at 9.2 percent which was the third consecutive month of increase and at that rate will double every 94 months.
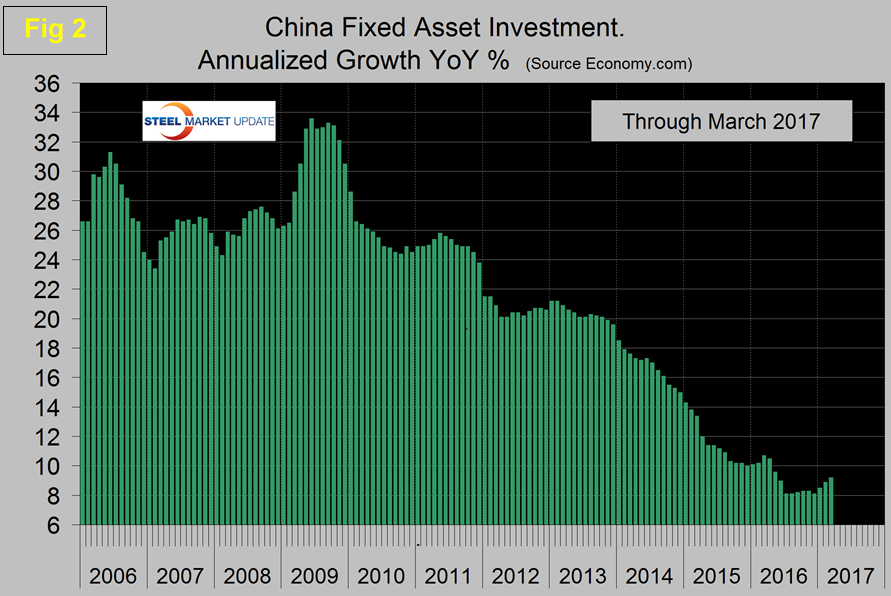
Economy.com wrote: “Rapid credit growth continues to fuel investment growth in China. China’s fixed-asset investment increased 9.2 percent y/y to March, up from 8.9 percent in the January-February period. The main drivers of growth were manufacturing and construction. Mining investment was a drag due to ongoing efforts to reduce overcapacity in heavy industries.” At SMU we understand that about half of fixed asset investment is based on real-estate transactions rather than construction expenditures but even so this rate of growth should eat into China’s overcapacity in steel and cement.
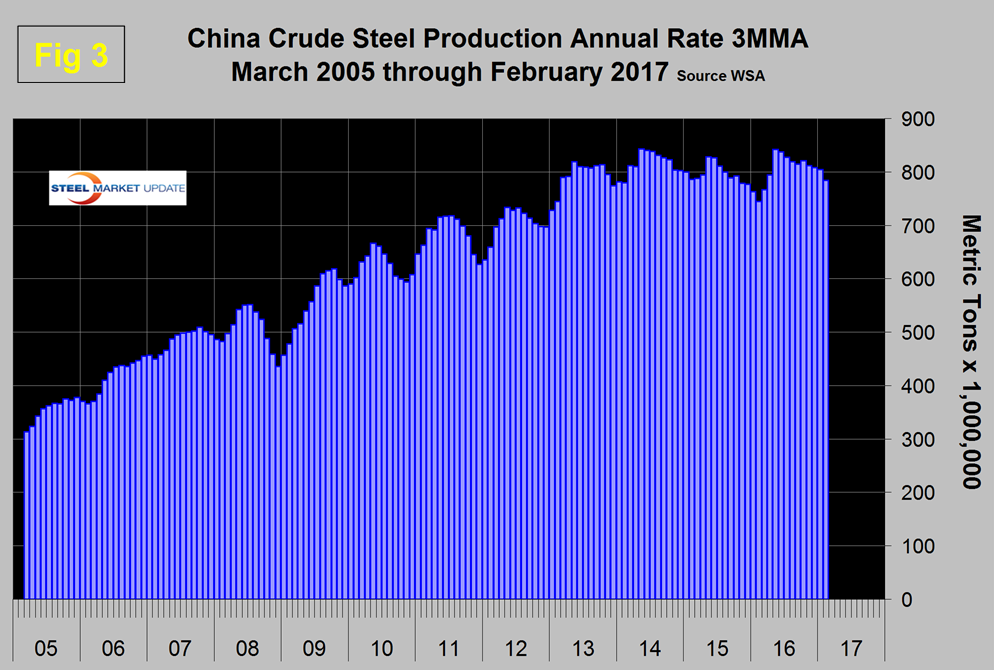
Figure 3 shows the 3MMA of China’s crude steel production through February when it accounted for 48.3 percent of global production.
Another way of looking at the change in growth is shown in Figure 4.
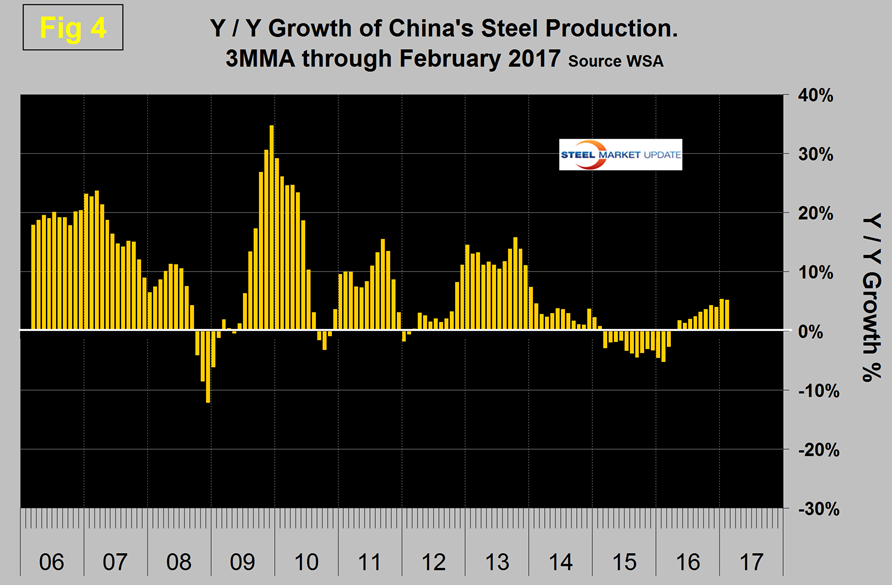
The May through February results followed zero growth in April last year. In early November the Ministry of Industry and Information Technology stated that foreign companies will be encouraged to participate in the reorganization of Chinese steel companies. Under the plan, the amount of crude steel capacity in China is to be cut by up to 150 million tons, to less than one billion tons by 2020, as demand for the product drops. Any project that aims to expand steel production capacity will be banned. The plan also requires energy consumption in the steel industry to be reduced by more than 10 percent while major pollutants must be cut by more than 15 percent. The central government reiterated that cutting overcapacity is high on its reform agenda as excess capacity in sectors such as steel and coal has weighed on the country’s overall economic performance.
SMU Comment: The recent trade cases have drastically reduced the shipments of HRC and CRC from China to the US. Figures 5 and 6 have been copied from the SIMA web site and illustrate the effect of recent trade cases brought against Chinese producers.
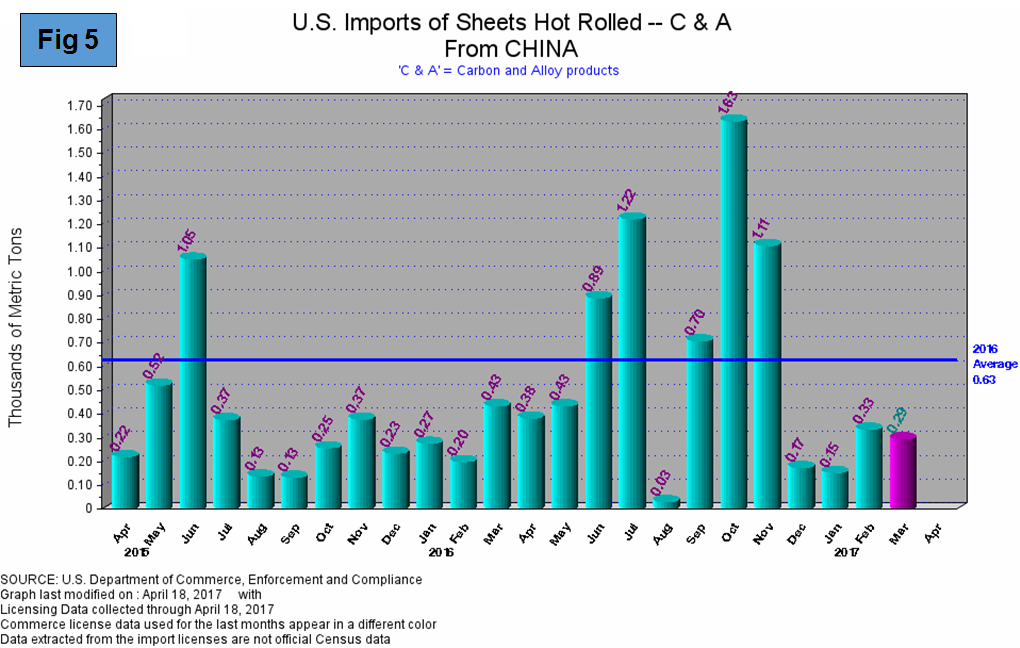
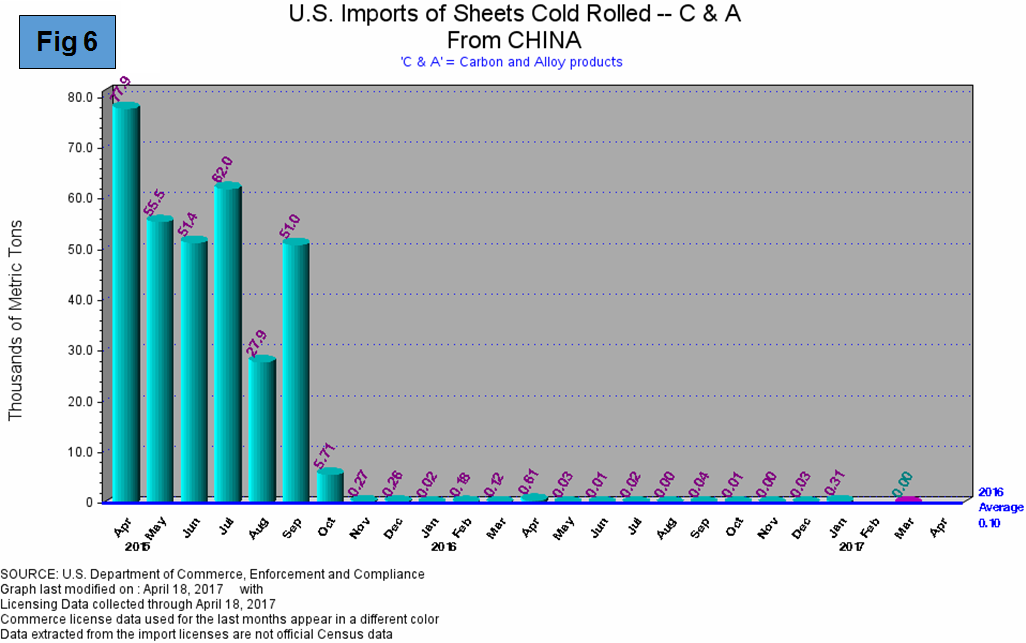
In Q1 2017 China shipped 789 tonnes of HRC to the US out of an import total of almost 400,000 tonnes and 317 tonnes of CRC out of a total of over 584,000 tonnes. Please note the Y axis scales are quite different on these two graphs which makes a comparison more difficult but the CRC chart is particularly dramatic. If the HRC went back further in time it would look similar for the same reason.


