Market Data

April 24, 2017
Manufacturing Update through March 2017
Written by Peter Wright
This report summarized seven data sources that describe the state of manufacturing in the US. We have reported on most of these separately in our Steel Market Update publications therefore will be brief in this summary. We don’t expect these data sources to all point in the same direction but our intention in summarizing them in one document is to try to get a consensus of the state of this critical steel consumption sector.
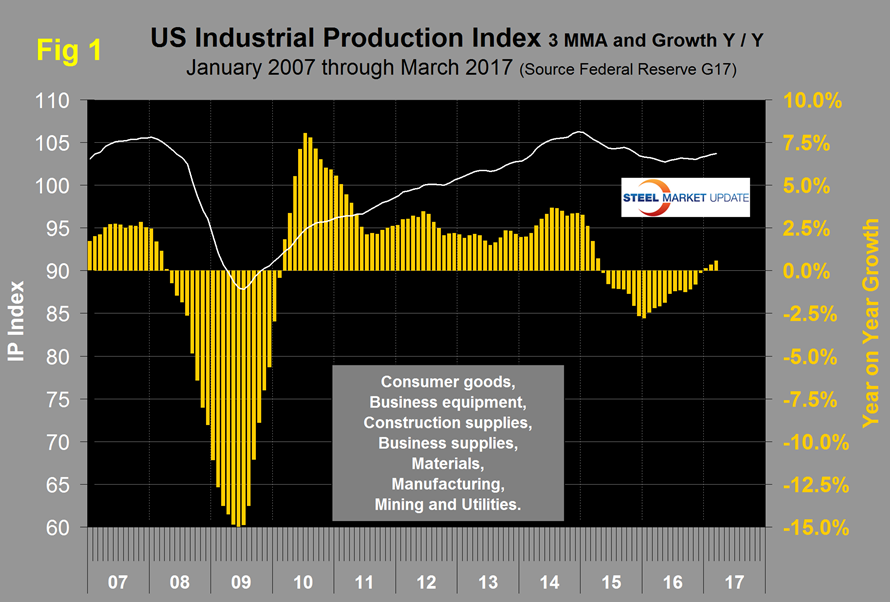
The Industrial Production Index: Figure 1 shows the IP index since January 2007 with the year/year growth. The three month moving average (3MMA) declined every month from October 2015 through December 2016 as shown by the brown bars in Figure 1. January this year was the first month of positive growth in the 3MMA since September 2015. Growth improved and accelerated in each month of the first quarter.
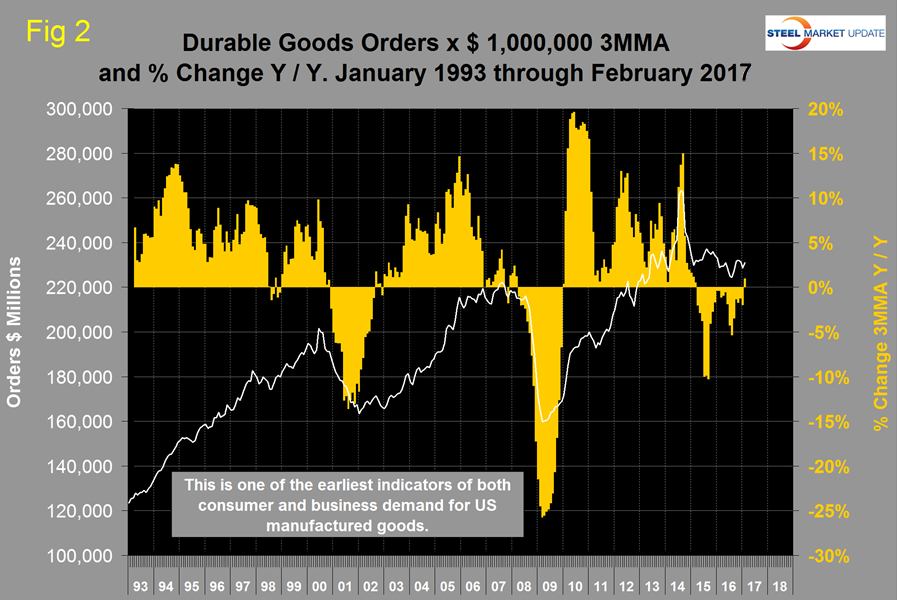
New Orders for Durable Goods: Figure 2 shows the monthly orders for durable goods since January 2010 with the percent change y /y. The abnormal peak of August 2014 was a surge in civil aircraft orders. February 2017 was the first month since March 2015 to have positive y/y growth.
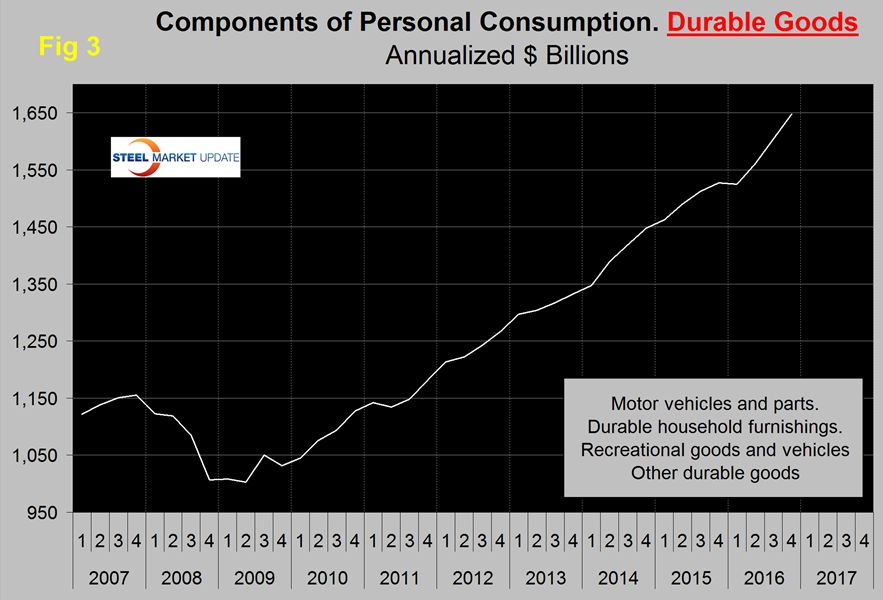
The Durable Goods portion of GDP: A subcomponent of the quarterly data for US GDP is durable goods which is part of the personal consumption calculation. It therefore contains no military hardware or civil aircraft data. This is shown in Figure 3 and presumably because of the exclusions just mentioned looks nothing like Figure 2. Durable goods manufactured for personal consumption have been on a healthy growth curve ever since the end of the recession with a slight blip at the end of 2015.
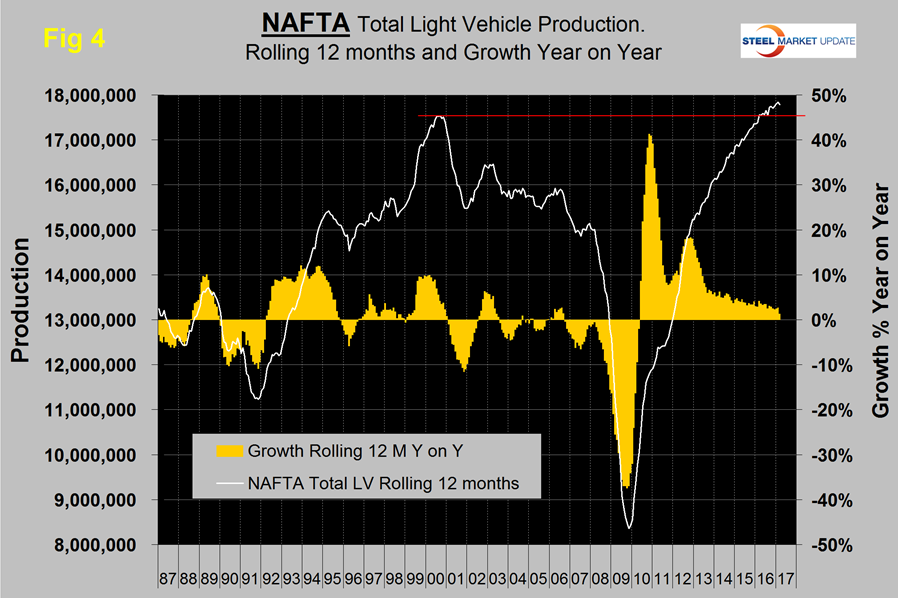
Auto Production in NAFTA was still experiencing a 1.3 percent y/y growth rate through March which considering that output is at an all-time high is good (Figure 4). The US component is growing at 0.3 percent y/y.
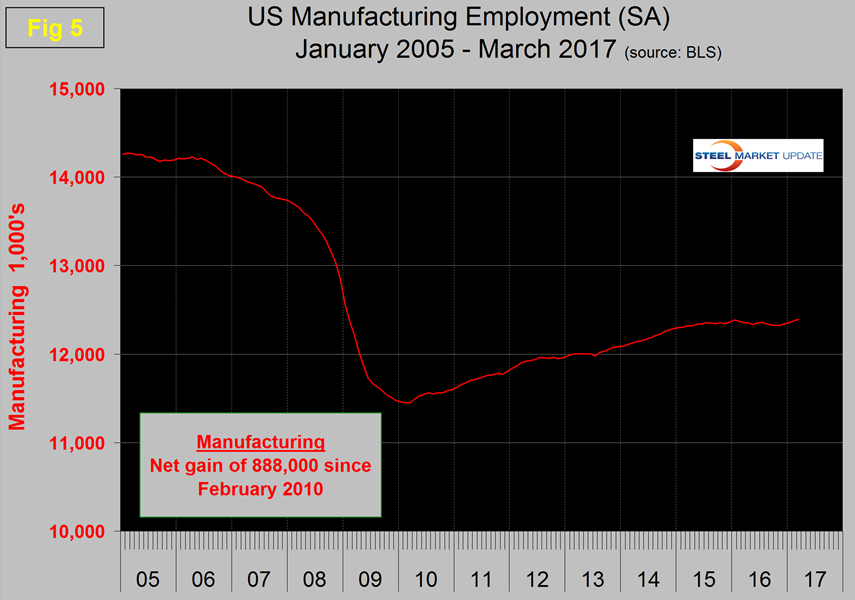
Manufacturing Employment dived during the recession and gradually improved from the spring of 2010 through 2014. Growth was flat in 2015 and declined slightly in 2016 when 23,000 jobs were lost in the year as a whole. However there was a turnaround in the four months through March this year when 67,000 manufacturing jobs were created (Figure 5).
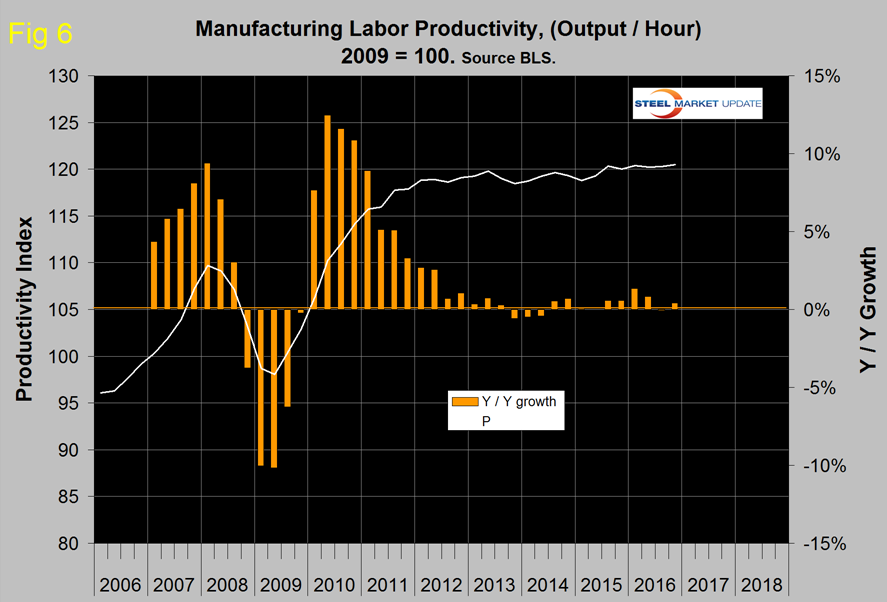
Manufacturing Productivity: Manufacturing labor productivity in the four quarters of 2016 averaged a 0.63 percent gain y/y which was up from 0.31 percent in 2015 (Figure 6).
The ISM Manufacturing Index is a diffusion index. The Institute of Supply Management states that, “diffusion indexes have the properties of leading indicators and are convenient summary measures showing the prevailing direction of change and the scope of change. A PMI reading above 50 percent indicates that the manufacturing economy is generally expanding, while below 50 percent indicates that it is generally declining.” Figure 7 shows the 3MMA of the ISM index from January 1997 through March 2017 with an improving trend for over a year. The index is currently signaling future expansion with a 3MMA value of 57.0 in March which was the best result since November 2014.
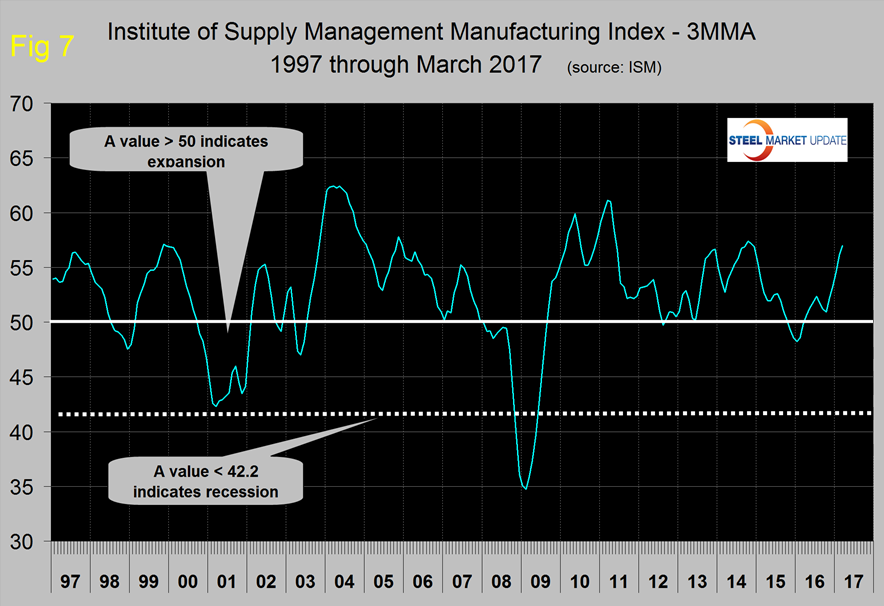
SMU Comment: On balance the various measures of the health of manufacturing are encouraging. We give the ISM index the most credence and it is also the only leading indicator of the group. The worst indicator is new orders for durable goods which is also of the least interest to the steel industry because it is so swayed by civil aircraft and military orders. Auto assemblies and its supplier industries are doing well in NFTA and the US is holding its share. Manufacturing employment has had positive growth for four months through March and the latest employment component of the ISM index was the highest since June 2011.