Analysis

May 3, 2017
Construction Expenditures through March 2017
Written by Peter Wright
In summary, the March CPIP data released on May 1st, yielded mixed results. Private expenditures recorded overall growth with the exception of manufacturing, transportation and religious structures. However, State & Local and Infrastructure spending continued to contract. Data in this report is not seasonally adjusted or corrected for inflation.
![]() At SMU we analyze the CPIP data with the intent of providing a clear description of activity that we believe accounts for over 30 percent of total steel consumption. Please see the end of this report for more detail on how we perform this analysis and structure of the data but in particular note that we are presenting NONE seasonally adjusted numbers. Much of what you will see in the press may differ from our presentation because others are basing their comments on adjusted values. Our rational is that construction is highly seasonal and our businesses function in a seasonal world. Also we don’t understand how the adjustments are made neither do we trust them.
At SMU we analyze the CPIP data with the intent of providing a clear description of activity that we believe accounts for over 30 percent of total steel consumption. Please see the end of this report for more detail on how we perform this analysis and structure of the data but in particular note that we are presenting NONE seasonally adjusted numbers. Much of what you will see in the press may differ from our presentation because others are basing their comments on adjusted values. Our rational is that construction is highly seasonal and our businesses function in a seasonal world. Also we don’t understand how the adjustments are made neither do we trust them.
Total Construction
Total construction came in at 3.1 percent growth on a rolling three month year over year (y/y), basis. This was up 0.2 percent compared to the 2.9 percent growth recorded over the past 12 month y y/ period. However, in the month of March the growth rate fell-back to 2.5 percent. Non-seasonally adjusted (NSA), total construction expenditures for the month were 78,880 million. The 12 month running total was 1.016 billion (Table 1).
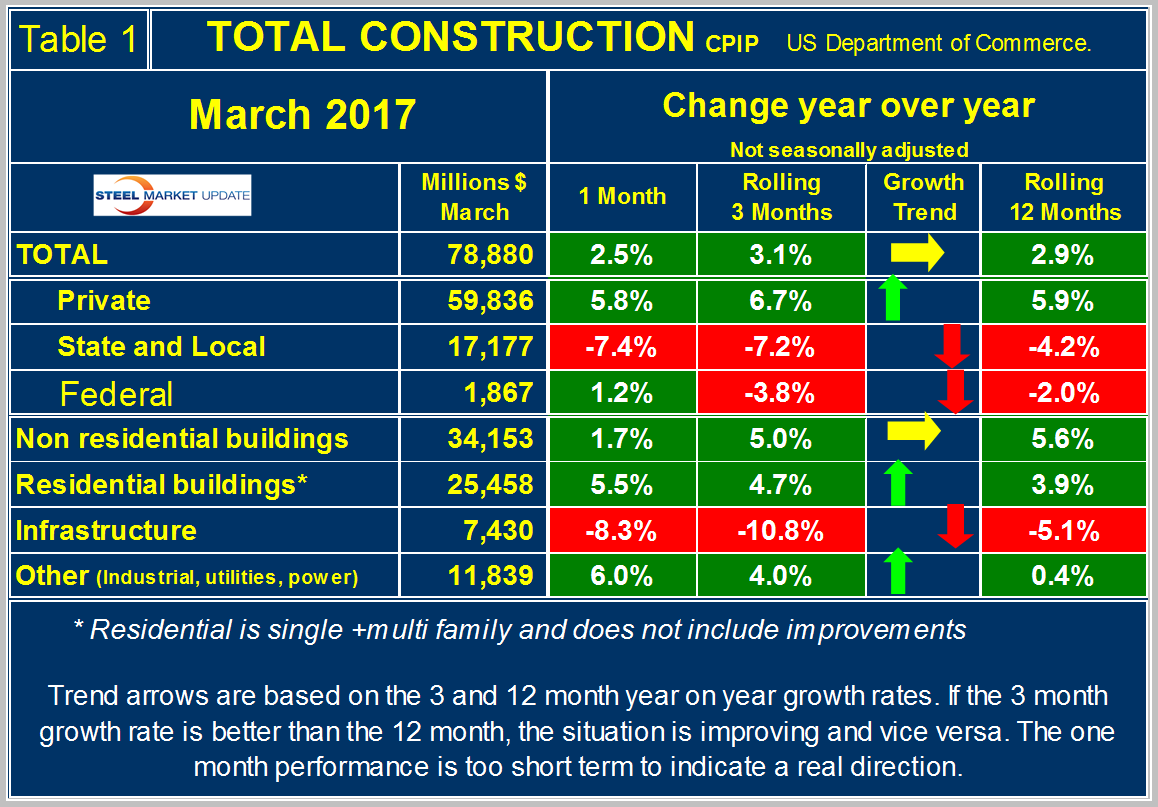
Private construction accounted for 75.8 percent of the total expenditures in March, leaving 21.8 percent for State & Local and 2.3 percent for Federal. The private sector posted growth of 5.9 percent on a rolling 12 month basis. The rate of growth has been steadily falling in percentage terms, yet has remained positive for 61 consecutive months. On a rolling 12 month basis, growth was 6.7 percent, stronger than the three month rate of growth indicating positive momentum. Momentum is positive if the 3 month value subtract 12 month value is a positive number. The red, green and yellow arrows on the tables indicate the direction of momentum.
State and Local total construction contracted further, off 4.2 percent on a rolling 12 month basis. This value been negative for seven months in a row with each successive month recording a larger negative value than the previous month. On a rolling three y/y comparison, growth was down 7.4 percent, now 10 consecutive months of accelerating declines in percentage y/y terms. Thus momentum is negative 3.0 percent. Federal construction spending is also weakening, dropping 3.8 percent on a rolling three month y/y basis and off 2.0 percent on a rolling 12 month y/y comparison.
We study four sectors within total construction: Non-residential, residential, infrastructure and other. Other includes; industrial, utilities and power. Residential building and other recorded positive momentum in March. Non-residential buildings had flat momentum, while infrastructure had decidedly negative momentum.
Figure 1 illustrates the rolling 12 month expenditure history from 1995 to present on the left-hand Y axis and the percentage y/y growth on the right-hand Y axis.
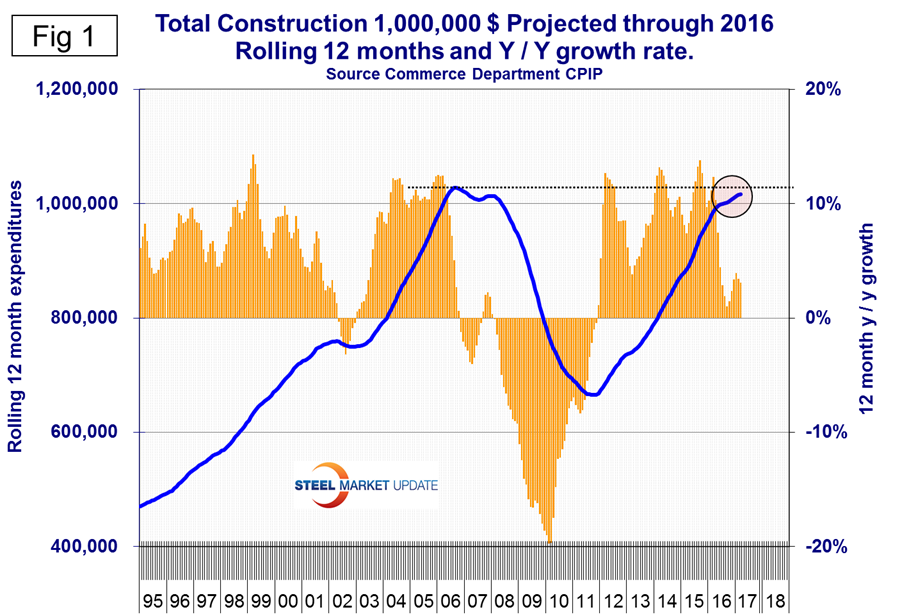
The rate of growth is slowing as indicated by both the slope change of the blue line and decline in percentage y/y change over the past 11 months. The good news is that growth continues to be positive and that we will in all probability eclipse the previous high water mark recorded in August 2006 within the next few months.
Private Construction
Table 2 shows the breakdown of private expenditures into residential and non-residential and subsectors of both.
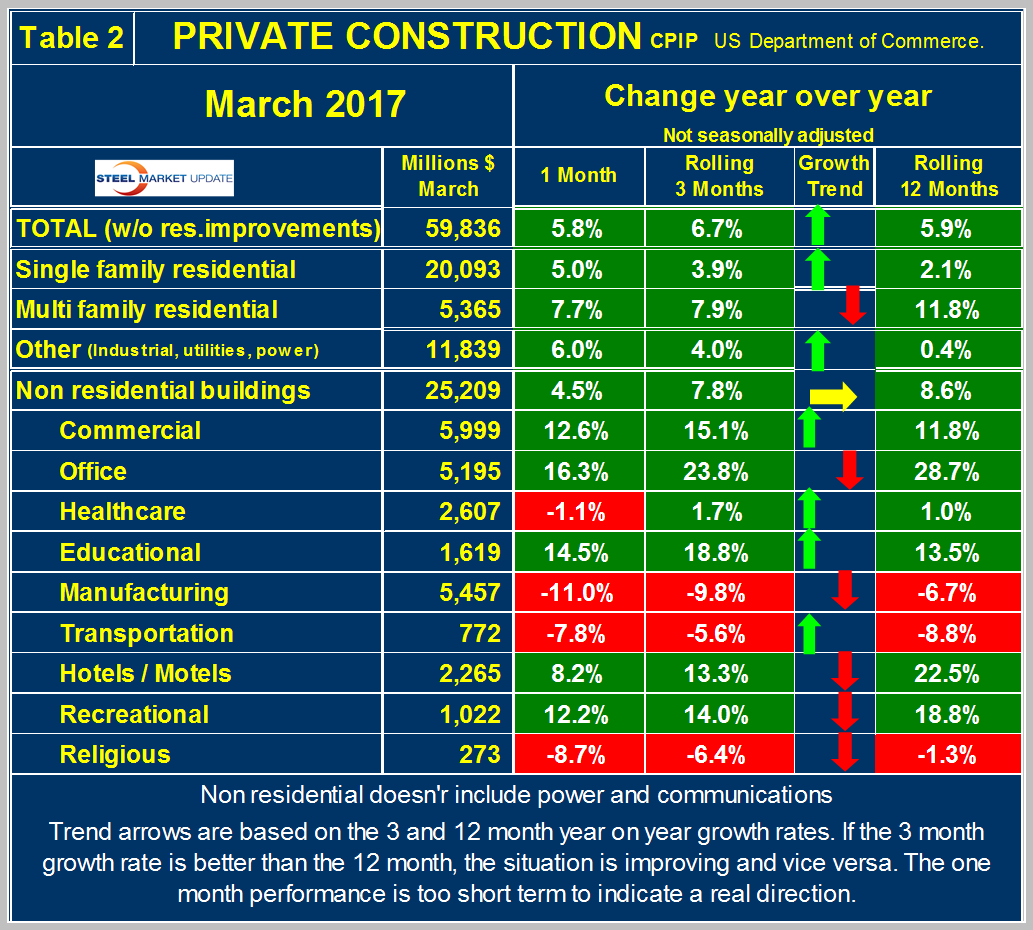
The growth rate of total private construction was 6.7 percent for the three months ending March, stronger than the rolling 12 month value of 5.9 percent, therefore momentum was positive 0.8 percent. Single family residential construction also recorded positive momentum, with 3.9 percent growth on a three month basis, up for 2.1 percent over the 12 month value. Multi-family residential growth was 7.9 percent, three months y/y, solid growth but slower than the blistering 11.8 percent growth rate established over the previous 12 months.
Other (industrial, utilities and power), jumped to 4.0 percent on the three month y /y basis, up from 0.4 percent on a 12 rolling month y/y comparison, so strong momentum in this sector.
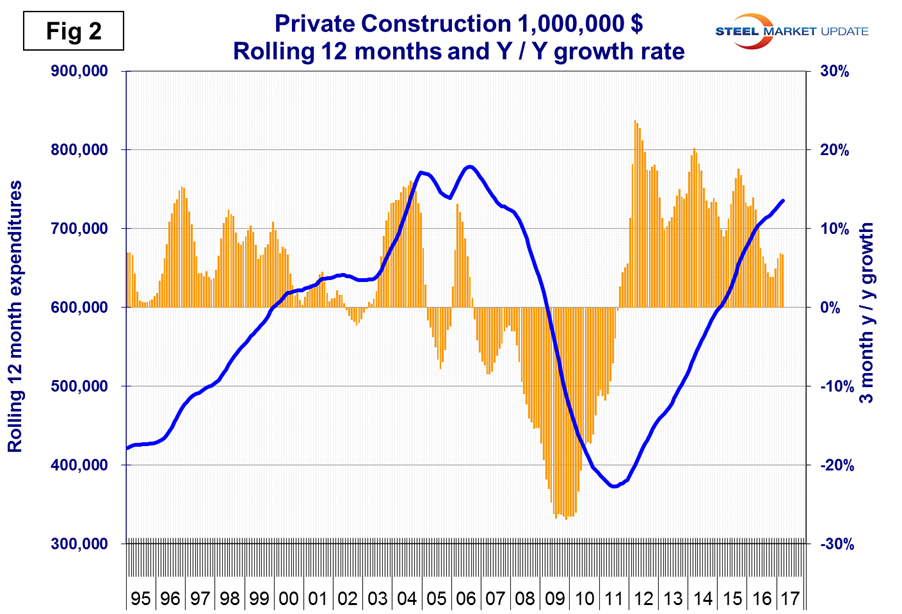
Looking at the project categories within non-residential buildings, we have bit of a mixed bag. Commercial, office, education, hotel/motel healthcare and recreation construction are all witnessing growth. These range from 1.8 percent (rolling 3 month y/y), for healthcare to 23.8 percent for office construction. Momentum was positive for commercial, healthcare and education, negative for office, hotel/motel and recreational. Sectors that are recording contracting expenditures (rolling 3 month y/y), include: manufacturing, transportation and religious buildings. Momentum was negative for transportation and religious buildings, positive for transportation. Figure 2 illustrates the history back to 1995 for private construction. The rate of growth bottomed-out in October, November of last year and has steadily ramped-up since then.
State and Local Construction
State & Local (S&L) construction contracted by 7.2 percent in the rolling three months through March y/y with negative momentum (Table 3).
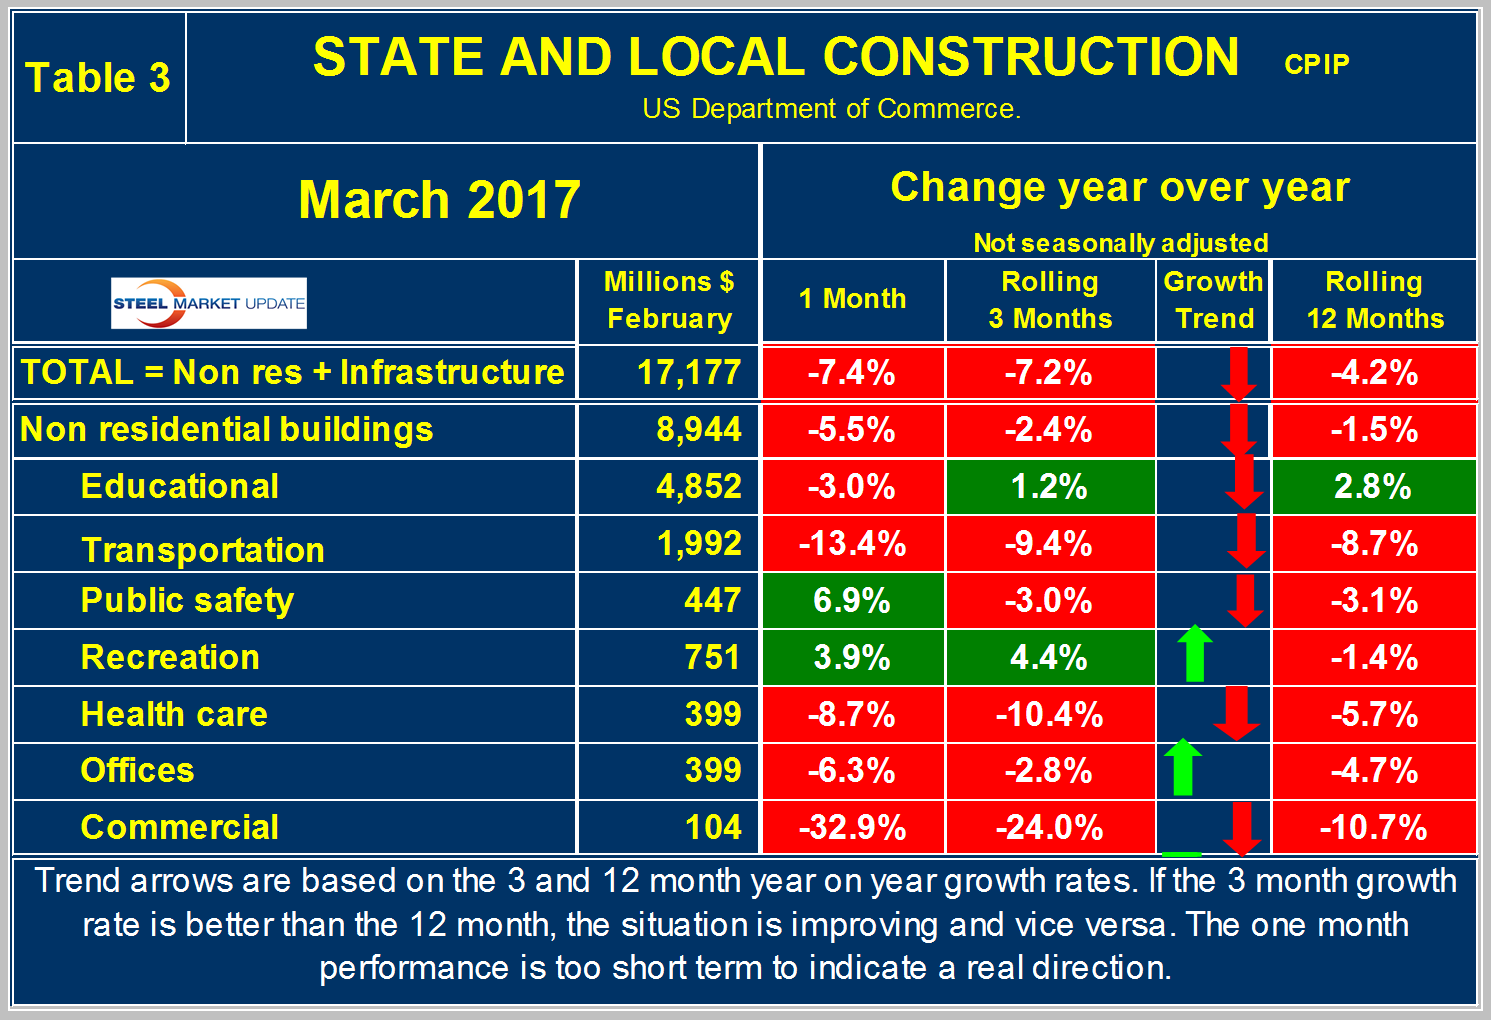
Non-residential S&L buildings overall contracted 2.4 percent with negative momentum on a rolling three months y/y basis. Every project category except educational (+1.2 percent) and recreation (+4.4 percent) posted negative growth on a rolling three months y/y metric. Only recreational facilities and offices saw positive momentum over the past three months. Figure 3 shows the pronounced slope change that began in March of 2016.
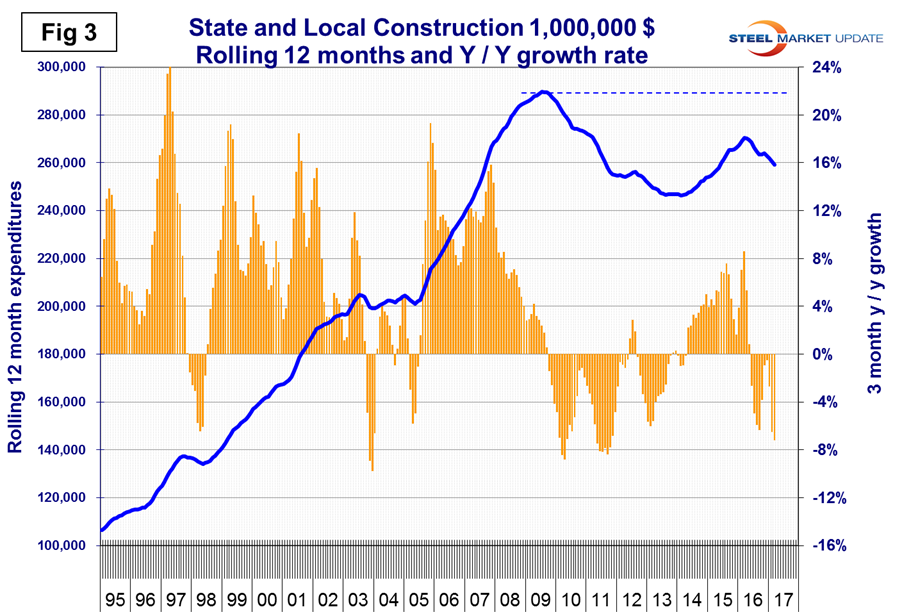
Since then, expenditures have declined and the percentage change y/y has been negative. Comparing Figures 2 and 3 we see that S&L construction did not have as severe a decline as private work during the recession and that private work bounced back faster. Private expenditures are not likely to exceed the pre-recession high in 2017 but the downturn in S&L means that a full recovery is unlikely to be achieved in this decade.
Infrastructure
Total infrastructure spending fell by 10.8 percent on a rolling three month y/y basis and by 5.1 percent on a rolling 12 month y/y comparison. Pavement was the only project category to record increased spending, up a solid 11.3 percent, on a rolling three month y /y basis and +1.1 percent on a rolling 12 month y/y comparison. Expenditures in all of the other categories plummeted ranging from -6.1 percent for highways & streets to -34.1 percent for bridges. Momentum was sharply negative across the board, with the exception of paving which recorded a strong 10.2 percent momentum (Table 4).
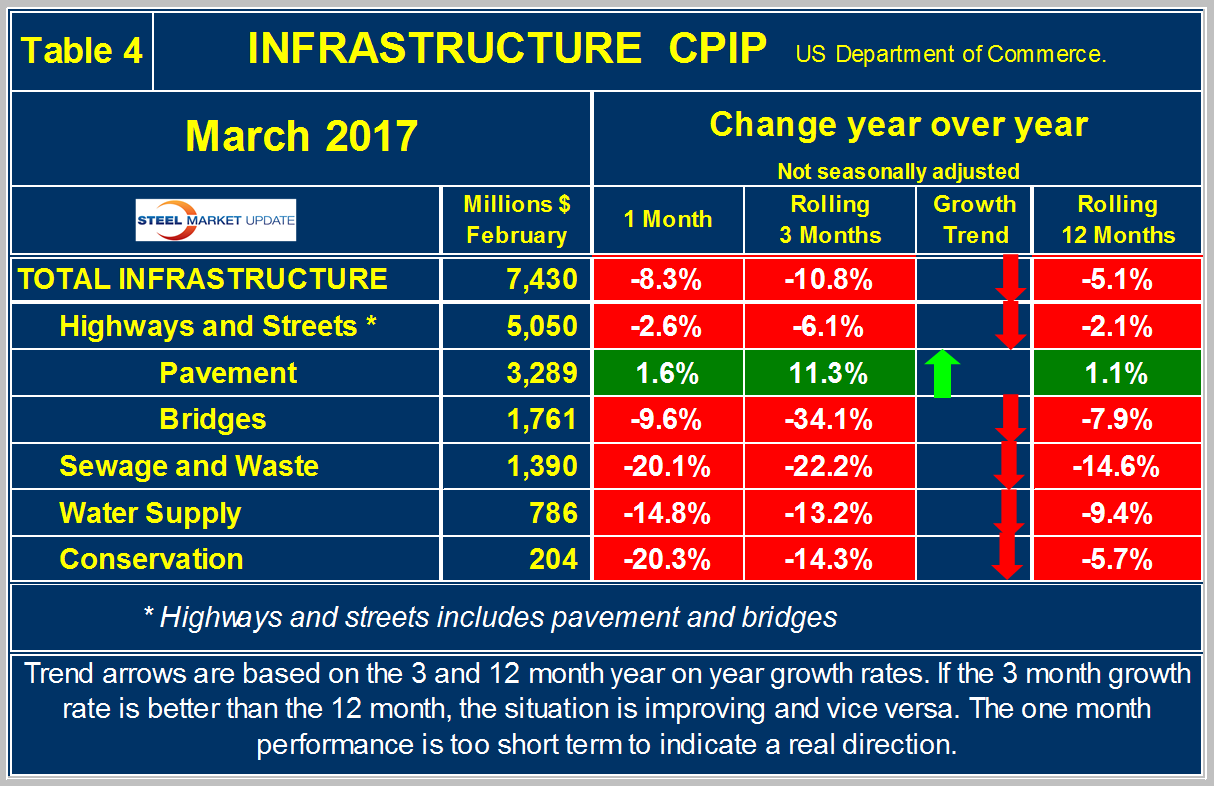
Figure 4 shows the distinct slope change that began in August of 2016.
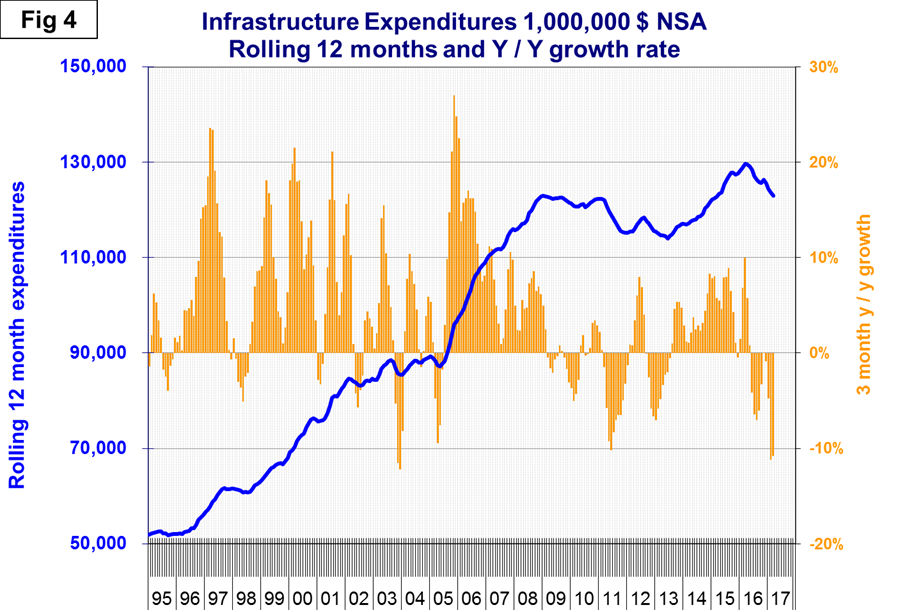
Since then, expenditures have declined and the percentage change y/y has been negative. The $305 billion congressional bill to fund roads, bridges, and rail lines that was authorized in December 2015 was the largest reauthorization of federal transportation programs approved by Congress in more than a decade, ending a prolonged period of short term stopgap bills. It would seem that some of this money would have found its way into infrastructure projects by now some 15 months after the passage of the bill. The results in Table 4 and Figure 4 indicate that this is not the case.
Total Building Construction Including Residential
Figure 5 compares year to date expenditures for building construction for 2016 and 2017.
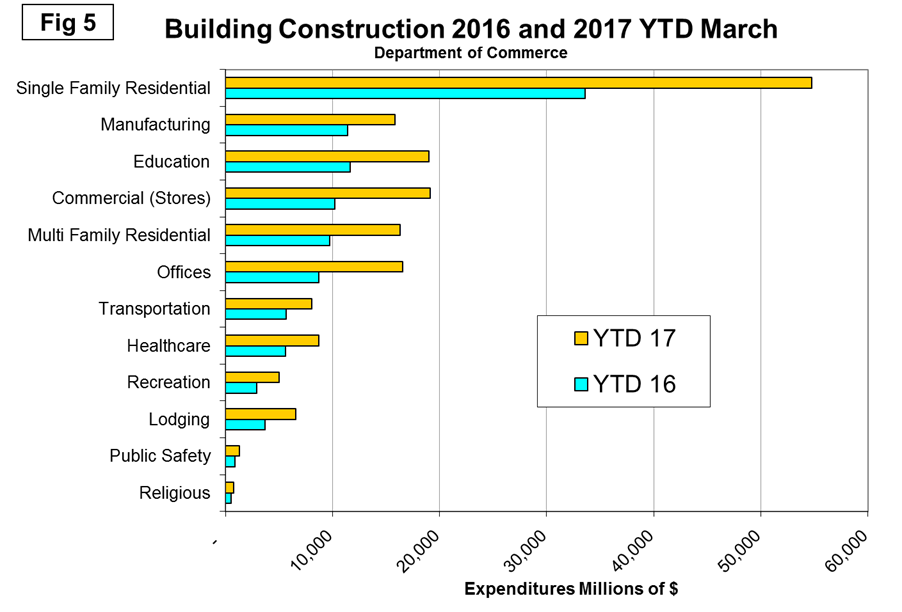
Single family residential is dominant and in the 12 months of 2016 totaled $243 billion, up from $233 billion in 2015. For the first three months of 2017, residential is off to a terrific start with single family up 63.1 percent y/y and multi-family up 67.4 percent y/y. All non-residential project segments had positive growth led by offices up by 89.4 percent and commercial (mainly stores) up by 86.8 percent.
Explanation: Each month the Commerce Department issues its construction put in place (CPIP) data, usually on the first working day covering activity two months earlier. Construction put in place is based on spending work as it occurs, estimated for a given month from a sample of projects. In effect the value of a project is spread out from the project’s start to its completion. This is different from the starts data published by the Census Bureau for residential construction, by Dodge Data & Analytics and Reed Construction for non-residential and Industrial Information Resources for industrial construction. In the case of starts data the whole project is entered to the data base when ground is broken. The result is that the starts data can be very spiky which is not the case with CPIP.
The official CPIP press release gives no appreciation of trends on a historical basis and merely compares the current month with the previous one on a seasonally adjusted basis. The data is provided as both seasonally adjusted and non-adjusted. The detail is hidden in the published tables which we at SMU track and dissect to provide a long term perspective. Our intent is to provide a rout map for those subscribers who are dependent on this industry to “Follow the money.” This is a very broad and complex subject therefore to make this monthly write up more comprehensible we are keeping the information format as consistent as possible. In our opinion the absolute value of the dollar expenditures presented are of little interest. What we are after is the magnitude of growth or contraction of the various sectors. In the SMU analysis we consider only the non-seasonally adjusted data. We eliminate seasonal effects by comparing rolling three month expenditures year over year. CPIP data also includes the category of residential improvements which we have removed from our analysis in the rational that such expenditures are minor consumers of steel.
In the four tables included in this analysis we present the non-seasonally adjusted expenditures for the most recent data release. Growth rates presented are all year over year and are the rate for the single months result, the rolling 3 months and the rolling 12 months. We ignore the single month year/year result in our write ups because these numbers are preliminary and can contain too much noise. The arrows indicate momentum. If the rolling 3 month growth rate is stronger than the rolling 12 months we define this as positive momentum and vice versa. In the text, when we refer to growth rate we are describing the rolling 3 months year over year rate. In Figures 1 through 4, the blue lines represent the rolling 12 month expenditures and the brown bars represent the rolling 3 month year over year growth rates.