

Market Data

May 3, 2017
Currency Update for Steel Trading Nations
Written by Peter Wright
Please see the end of this report for an explanation of data sources.
The Broad Index value of the US $ is reported several days in arrears by the Federal Reserve, the latest value published was dated April 14th (Figure 1).
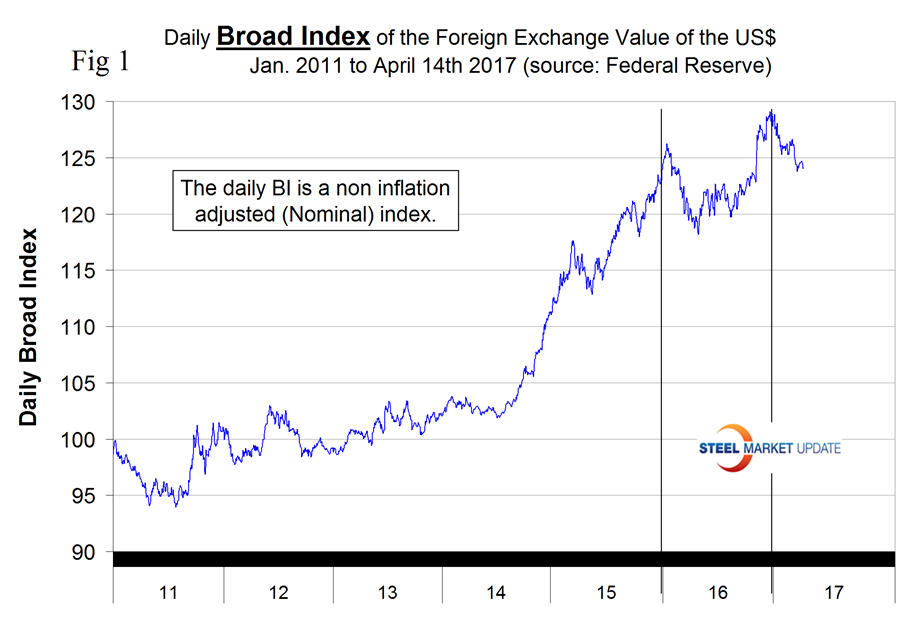
The dollar had a recent peak of 128.963 on January 3rd which was the highest value since April 4th 2004, almost 15 years. Traders anticipate interest rate differentials and have become much less hawkish on the dollar. Since January 3rd the dollar has weakened to 124.09 a decline of 3.8 percent and the lowest value since November 9th.
Each month we publish an update of Table 1 which even though it shows the change in value in four different time frames is still a bit of a snapshot of the value of the major sixteen steel and iron ore trading nations.
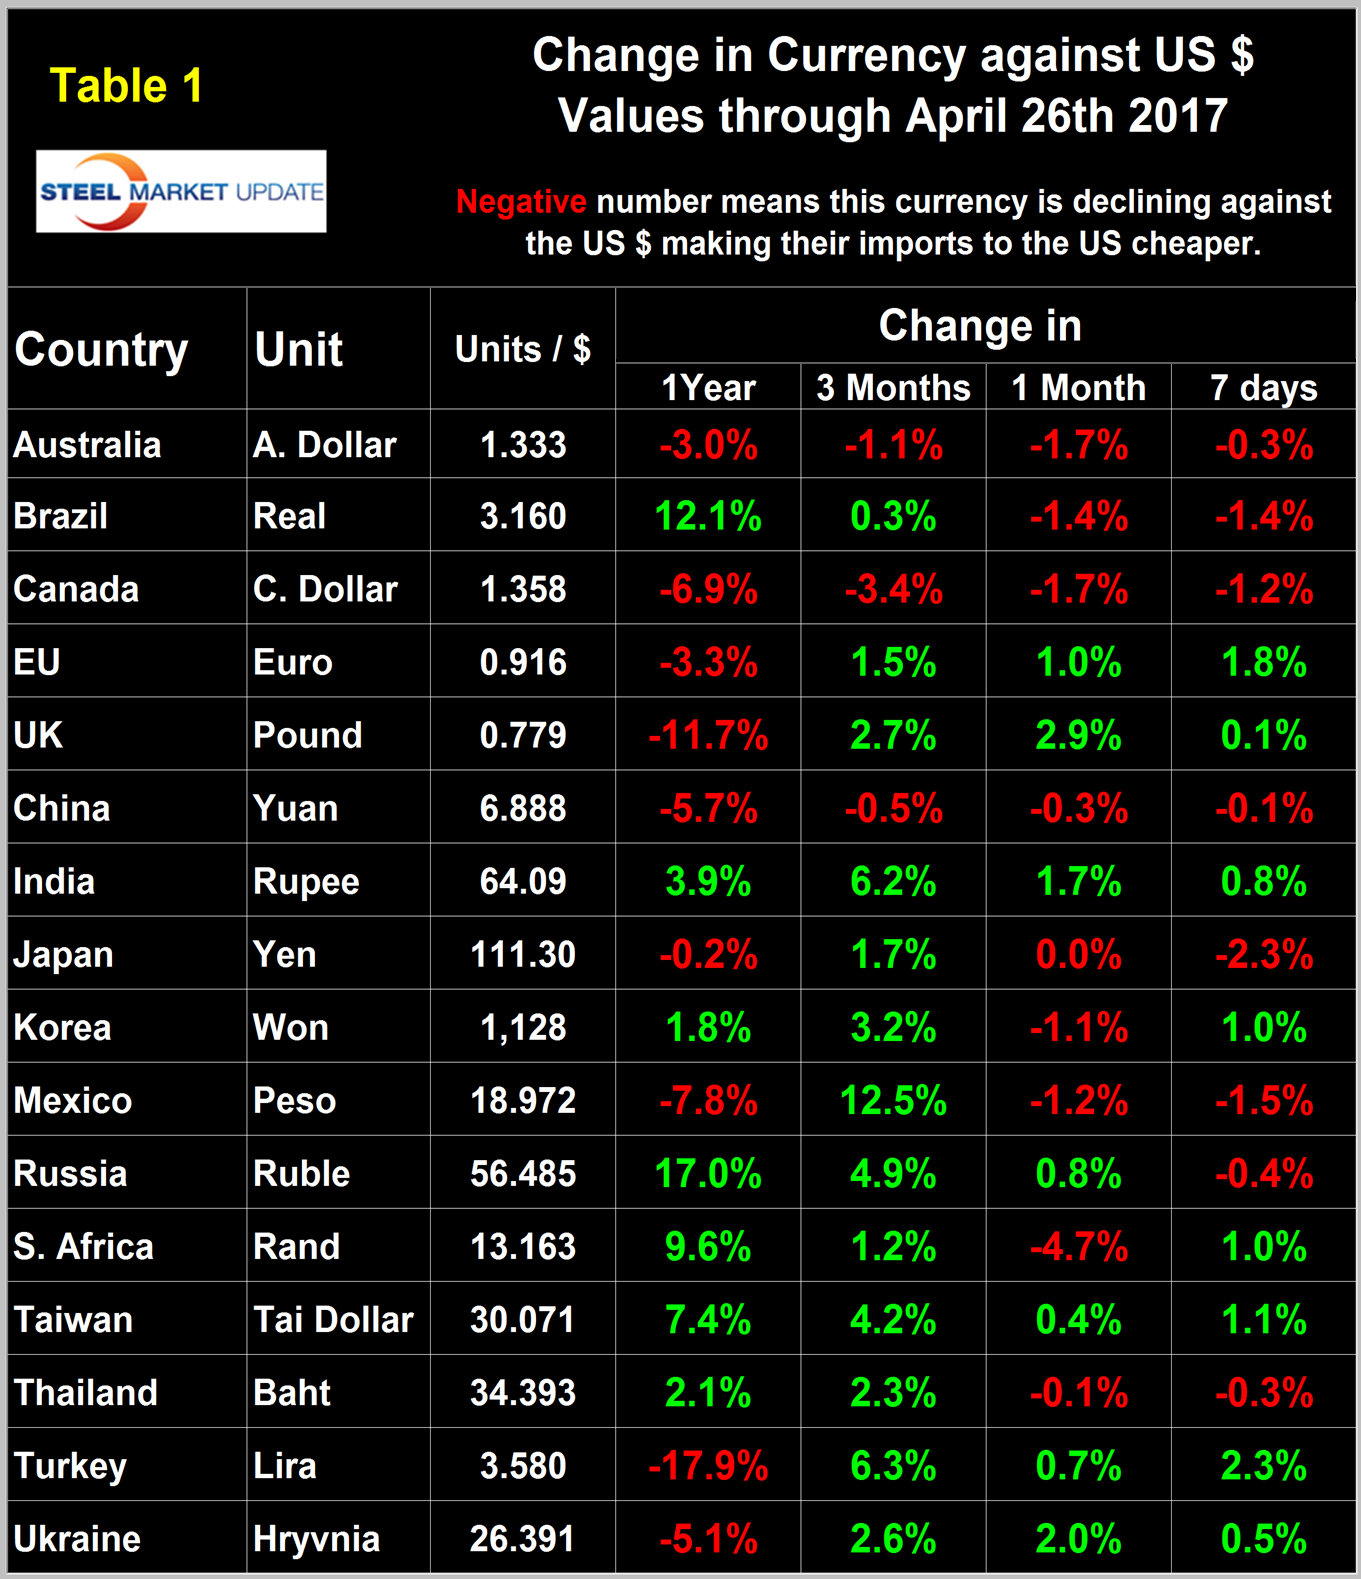
Snapshots are something we try to avoid in all our data presentations because direction is everything. Last month we began to take a different look and this month we have finished it as shown in Figure 2.
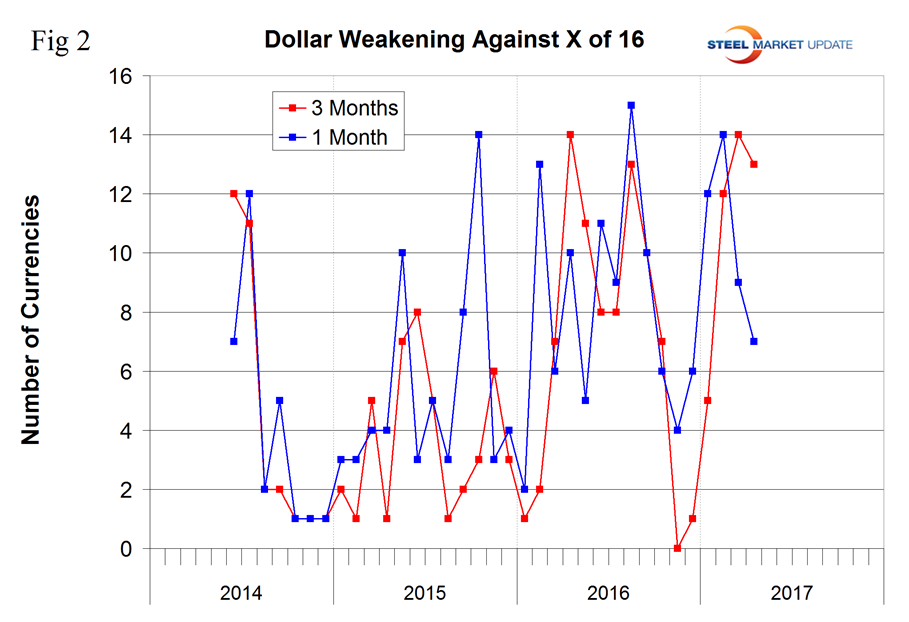
This show very dramatically how the direction in the value of the dollar on a rolling 3 month comparison has done a complete reversal between November 2016 when it was strengthening against all sixteen to March 2017 when it weakened against fourteen of the sixteen. In April the $ weakened against 13 of the 16. Table 1 is color coded to indicate strengthening of the dollar in red and weakening in green. We regard strengthening of the US Dollar as negative and weakening as positive because the effect on net imports. The April 26th version of Table 1 has the dollar weakening against seven of the sixteen at the one month level and against nine of the sixteen at the seven day level.
In each of these reports we comment on a few of the 16 steel trading currencies listed in Table 1. Charts for each of the 16 currencies are available through April 26th for any premium subscriber who requests them. We also include writings from experts who we regard as credible to explain some of the currency moves that we are living through.
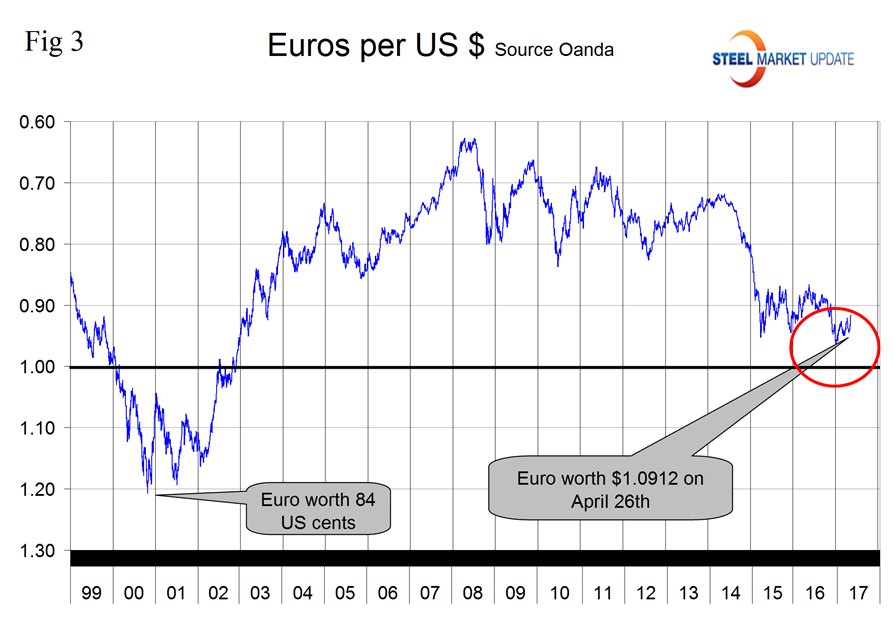
The Euro. On April 26th the Euro was worth 1.0912 US dollars. It has appreciated by 1.5 percent in the last three months with an erratic climb throughout the first four months of 2017 (Figure 3).
Earlier this month ECB Chairman, Mario Draghi said, “”Before making any alterations to the components of our stance – interest rates, asset purchases and forward guidance – we still need to build sufficient confidence that inflation will indeed converge to our aim over a medium-term horizon, and will remain there even in less supportive monetary policy conditions. It is clear that continued support for demand remains key, interest rates will remain at present or lower levels for an extended period of time, and well past the horizon of asset purchases – is still appropriate to make sure that growth and inflation are solid enough to withstand the end of stimulus.”
On April 25th D.H. Taylor wrote, “It may be time to get into the Euro carry trade again. Two major event risks have been cleared and stability should reign in the markets going forward. The French election saw Macron advance which is generally positive for the markets, USDJPY spiked up a full figure on the news. And, North Korea appears to be a non-event. I believe the ECB is going to be pressured to move interest rates and end their Quantitative Easing (QE) program. I am getting into the carry trade ahead of the ECB meeting and the BoJ meeting. I think the potential for EUR to move higher from this point is solid.
There have already been grumblings over the QE program from Germany and other more hawkish regions in the EU. The current program has the ECB buying €60 billion per month; this is down from the original €80 billion per month. There has been some inflation coming into the world’s economies, at least in the United States and Europe, but not as much in Japan the real target destination for inflation:”
The Mexican Peso
The Peso has manifested the most dramatic strengthening of all the currencies we are examining here being up by 12.5 percent at the three month level. Two days after the US election the peso broke through the 20/US $ level for the first time ever and continued to decline until January 19th when it reached 21.9211/US $. Since then the peso has recovered to reach 18.49/$ on April 15th and declined slightly to 18.97 on April 26th (Figure 4.)
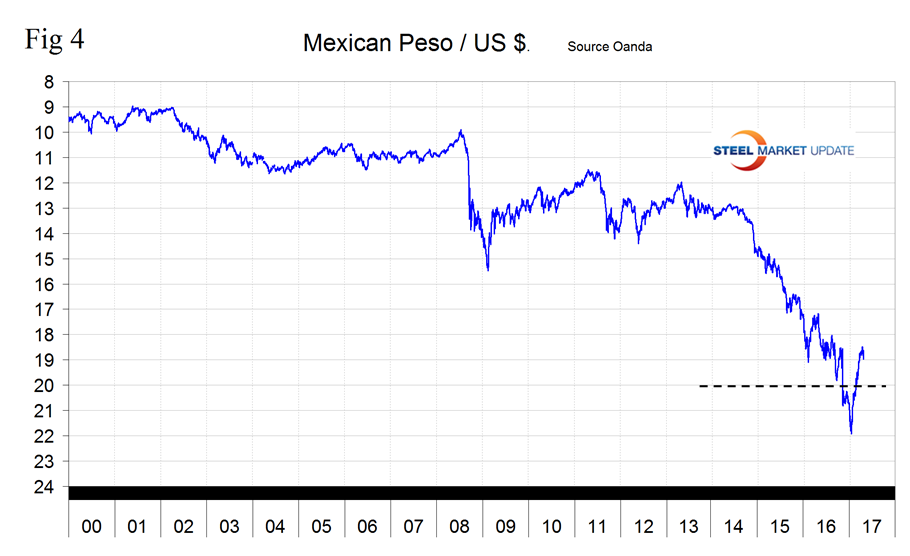
The Peso has appreciated by 12.52 percent in three months but given back 1.2 percent in the last month. On January 1st 1994, when the NAFTA was initiated it took only 3.5 pesos to buy one US dollar.
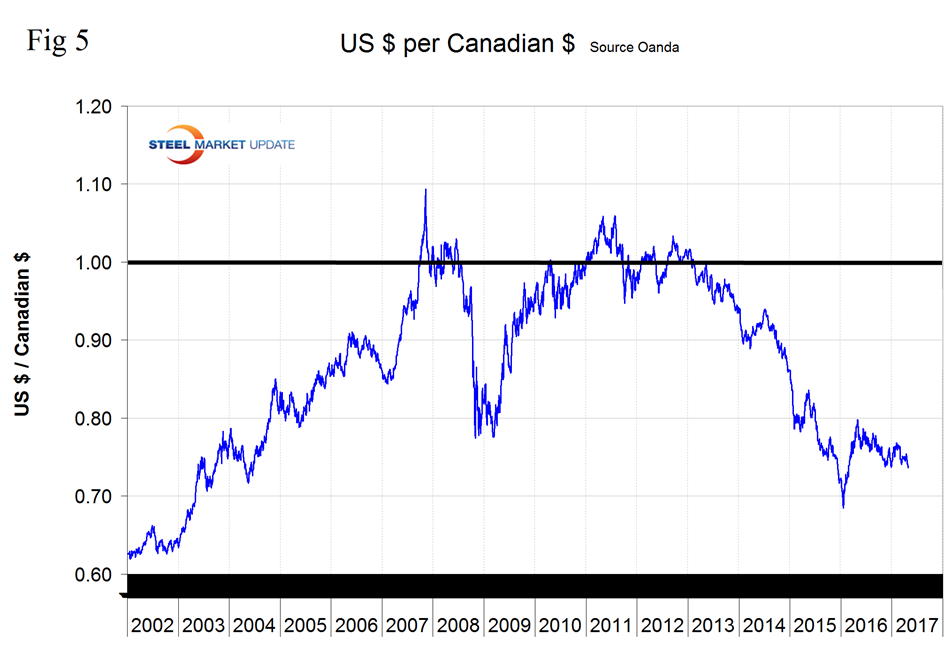
The Canadian Dollar
The Canadian $ has declined by 3.4 percent in three months with an acceleration in the last few days resulting from US threats of a lumber import tariff (Figure 5).
The Japanese Yen
In the last three months the Yen has appreciated by 1.7 percent but gave that back and more by depreciation by 2.3 percent in the last seven days, Figure 6.
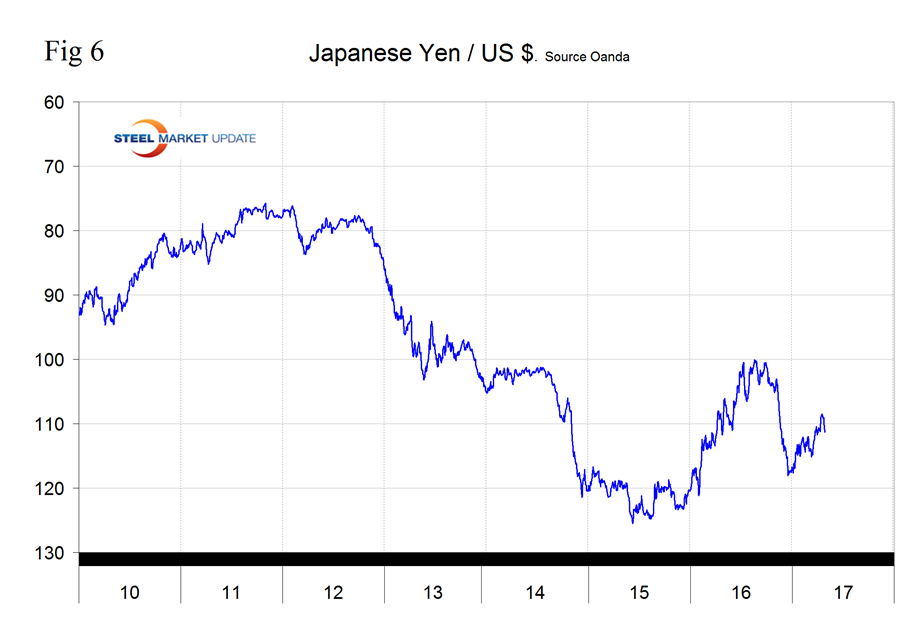
On April 24th David Belle wrote, ”Something else to note on the yen is that Japanese 10-year yields are slightly coming out of negative territory. Through 2016, they were pretty much negative. 2017 has been good so far for the Japanese 10-year, and I feel if we can remain above 0 percent for perhaps 6 months (so till June), we could see the yen’s strength proceeding into the third and fourth quarters of 2017.” April 27th from Wall Street breakfast, “the Bank of Japan stuck to the markets’ script at its policy meeting and kept monetary settings unchanged, but raised its forecast for 2017 domestic growth. It came with the lowering of inflation expectations and confirmation to continue with QE until prices meet the 2 percent target, stating it will “adjust policy if needed to maintain momentum.”
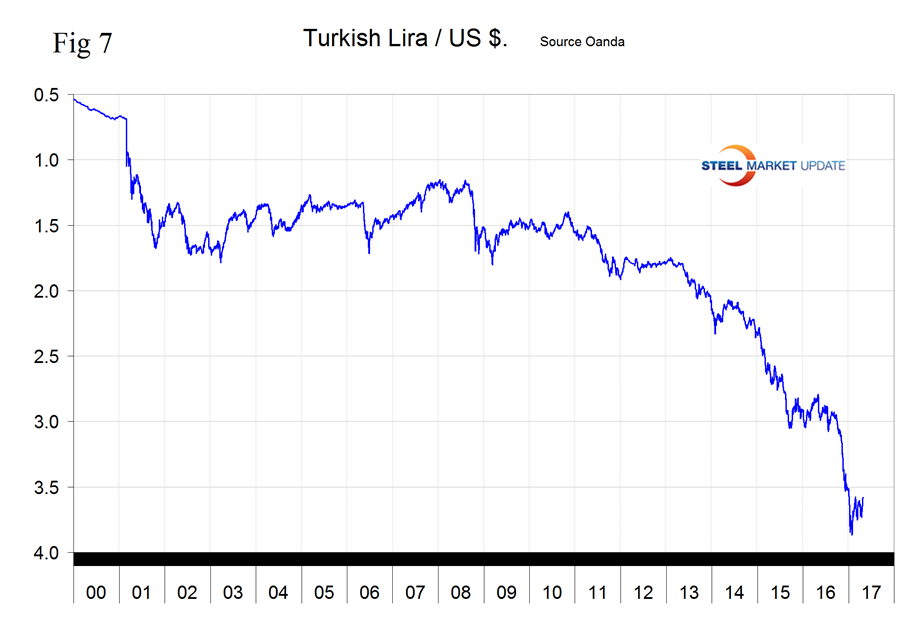
The Turkish Lira
Figure 7 shows the number of Lira necessary to buy one US $ since January 2000. The Lira had an all time low of 3.869 on January 27th and has since strengthened to 3.580/$.
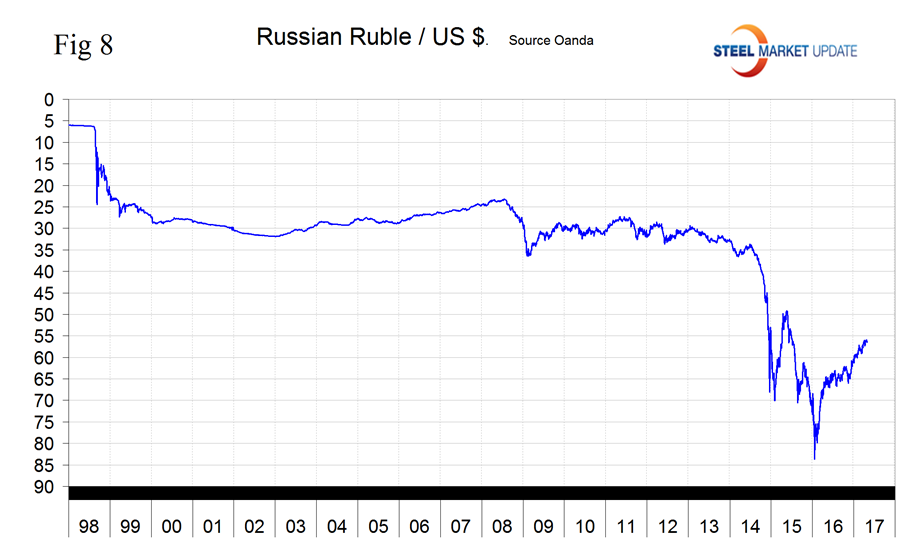
The Russian Ruble
The Ruble had an all time low of 83.665 on January 21st 2016 and has since strengthened to 56.485/US $. The Ruble is up by 17.0 percent in 12 months and by 4.9 percent in the last three months, Figure 8.
Explanation of Data Sources: The broad index is published by the Federal Reserve on both a daily and monthly basis. It is a weighted average of the foreign exchange values of the U.S. dollar against the currencies of a large group of major U.S. trading partners. The index weights, which change over time, are derived from U.S. export shares and from U.S. and foreign import shares. The data are noon buying rates in New York for cable transfers payable in the listed currencies. At SMU we use the historical exchange rates published in the Oanda Forex trading platform to track the currency value of the US $ against that of sixteen steel trading nations. Oanda operates within the guidelines of six major regulatory authorities around the world and provides access to over 70 currency pairs. Approximately $4 trillion US $ are traded every day on foreign exchange markets.


