

Market Data

July 19, 2017
Currency Trends: Dollar Value is in Free Fall
Written by Peter Wright
The value of the U.S. dollar is in free fall on the international foreign exchange markets.
Through July 18, the Broad Index value of the U.S. dollar had depreciated by 7 percent since January 3. Comparing on a rolling three-month basis, the index has declined every single day since January 20. (Please see the end of this report for an explanation of data sources.)
The analysis of currency trends is a highly technical undertaking; therefore, we at SMU rely on the opinions of experts as much as possible for our commentary.
On July 14, John M. Mason, a writer on current monetary and financial events, commented: “It looks as if the Federal Reserve will begin to reduce the size of its balance sheet this fall. Fed Chair Janet Yellen testified before the U.S. Congress on July 12 and basically gave the signal that the Fed will continue on its path to raise its policy rate of interest one more time this year, at the December meeting of the Federal Open Market Committee, and will begin to bring down the size of its securities portfolio later this year. September is the best guess for this move. The only ‘known’ thing on the Fed’s horizon that might cause a shift in this picture is the inflation situation. Ms. Yellen admitted in her testimony that there is a good deal of uncertainty surrounding the immediate future of the rate of inflation in the United States, and what happens with respect to this number could cause the Fed to alter its current plan. The basic feeling among Fed officials seems to be that the softness in the inflation numbers is a temporary phenomenon and that inflation will bounce back again to be on the Fed’s track of approaching its 2.0 percent target rate.”
The Broad Index value of the U.S. dollar is reported several days in arrears by the Federal Reserve. The latest value was published on July 14. Figure 1 shows the index value since January 2011, the remorseless decline this year, and the free fall in the latest values.
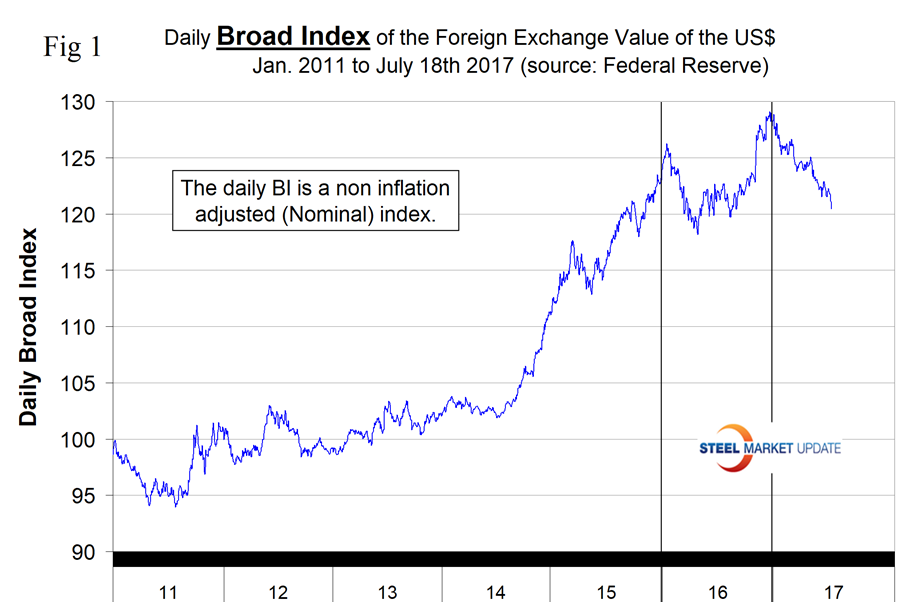
The dollar had a recent peak of 128.963 on Jan. 3, which was the highest value since July 4, 2004, almost 15 years. Traders anticipate interest rate differentials and have become much less hawkish on the dollar. Since Jan. 3, the dollar has weakened to 120.44 a decline of 7 percent. This was the lowest value since Sept. 6 last year.
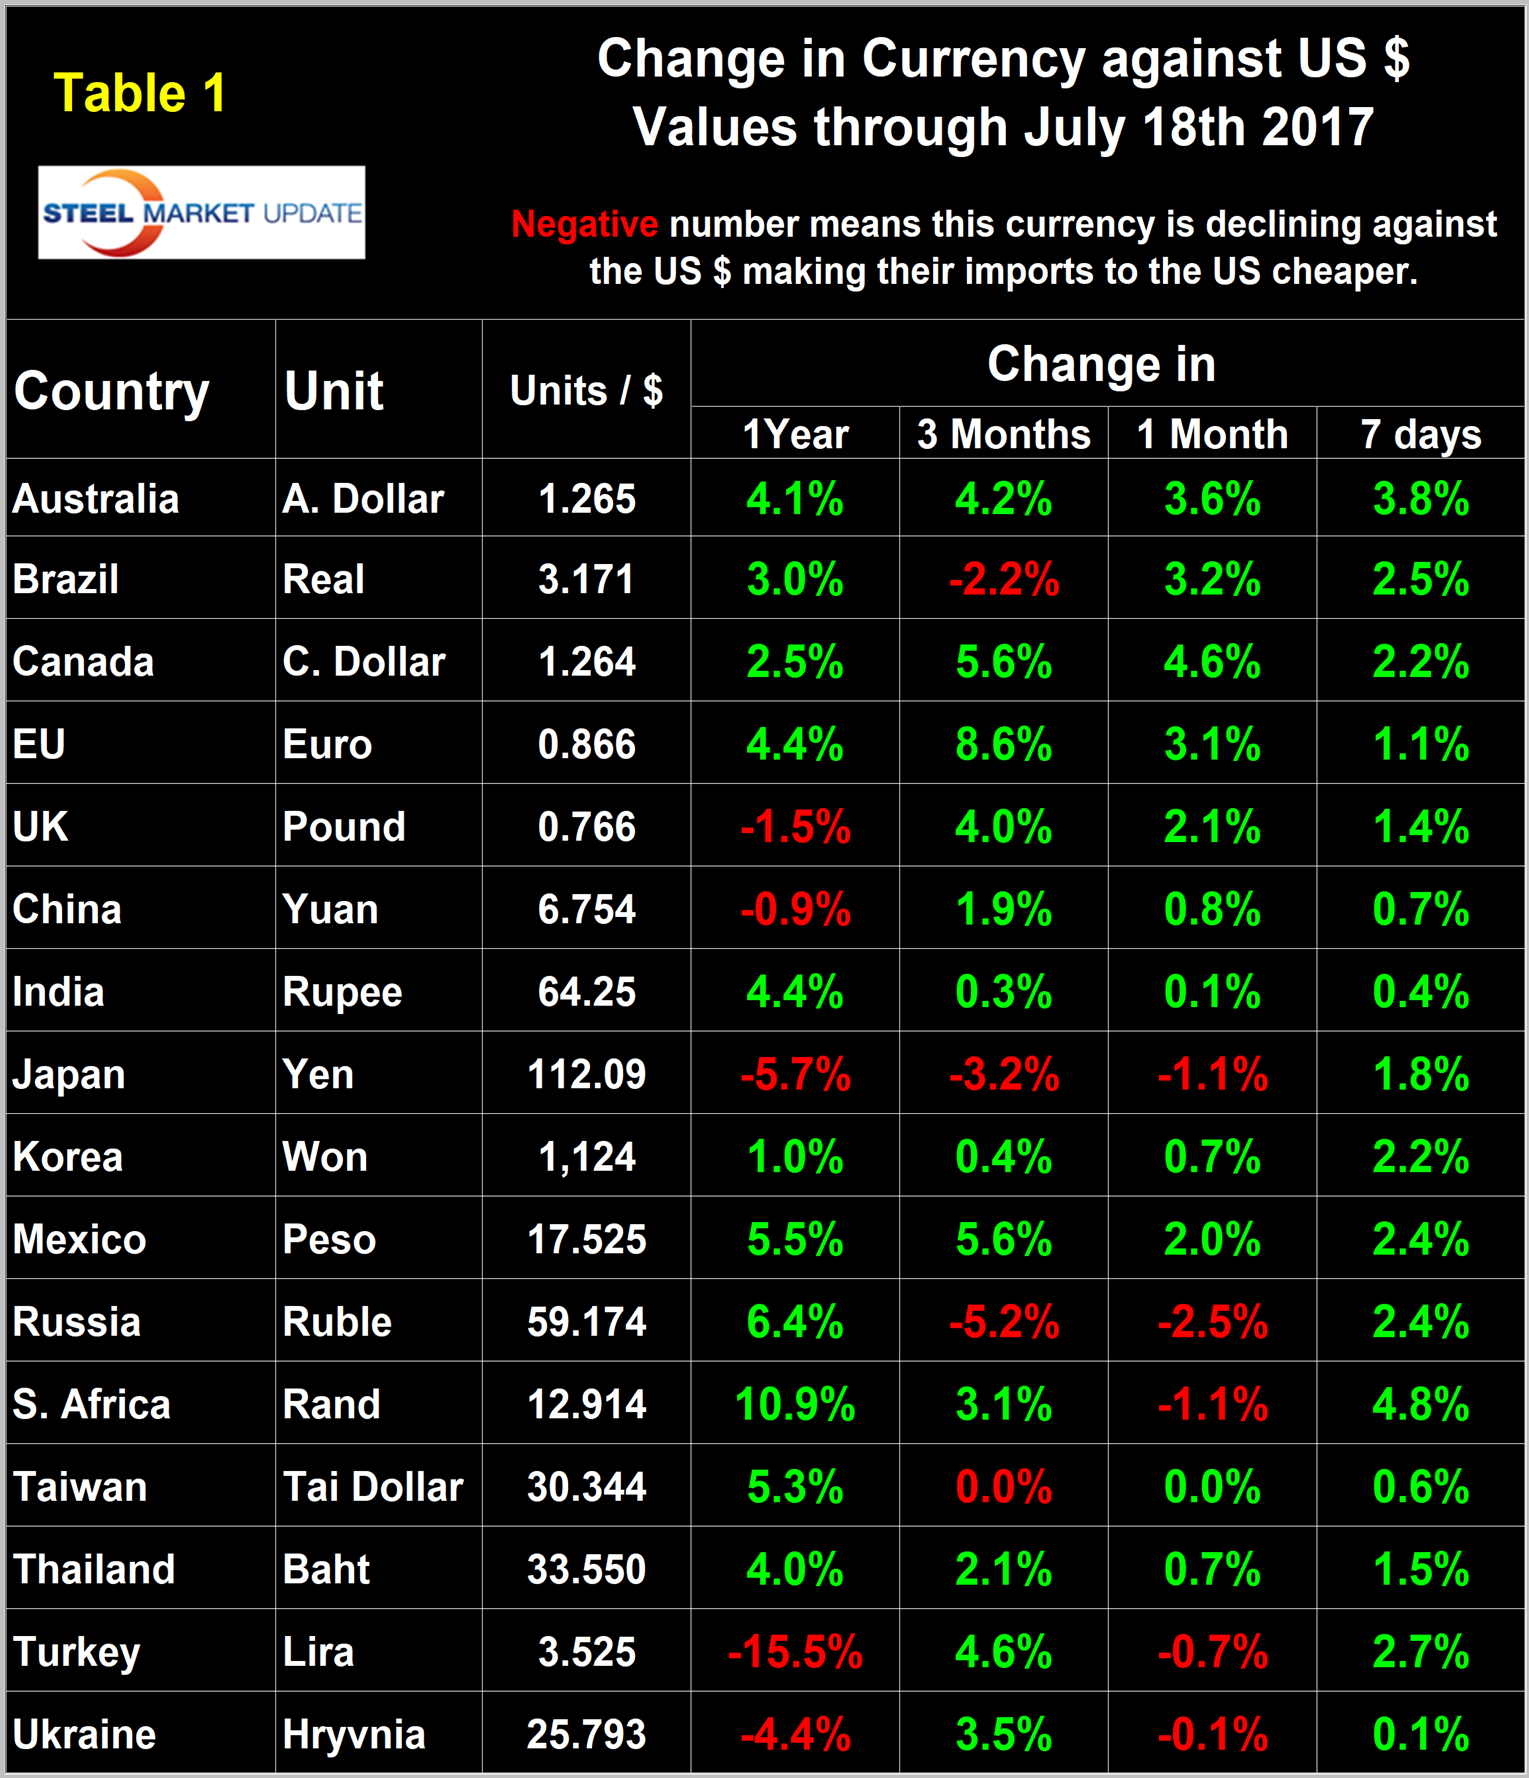
Each month we publish an update of Table 1, which shows the value of the U.S. dollar against the currencies of 16 major global steel and iron ore trading nations. The table shows the change in value in one year, three months, one month and seven days. Even though it covers four different time frames, it is still a bit of a snapshot, which is something we try to avoid in all our data presentations.
Direction is everything. We are now taking a supplemental look as shown in Figure 2.
This shows that in the last three months, the dollar has weakened against 12 of the 16 currencies at the three-month level. However, in the last seven days, the dollar depreciated against all 16 and by very substantial amounts in some cases. A declining dollar puts upward pressure on all commodity prices that are greenback denominated. Table 1 is color coded to indicate strengthening of the dollar in red and weakening in green. We regard strengthening of the U.S. dollar as negative and weakening as positive because of the effect on the trade balance of all commodities and also of the total national trade deficit.
In each of these reports, we comment on several of the 16 steel and iron ore trading currencies listed in Table 1, and over a period of several months will describe the history of all of them. Charts for each of the 16 currencies are available through July 18 for any premium subscriber who requests them. Our commentaries include quotations from experts whom we regard as credible to explain some of the recent currency moves.
The Russian Ruble
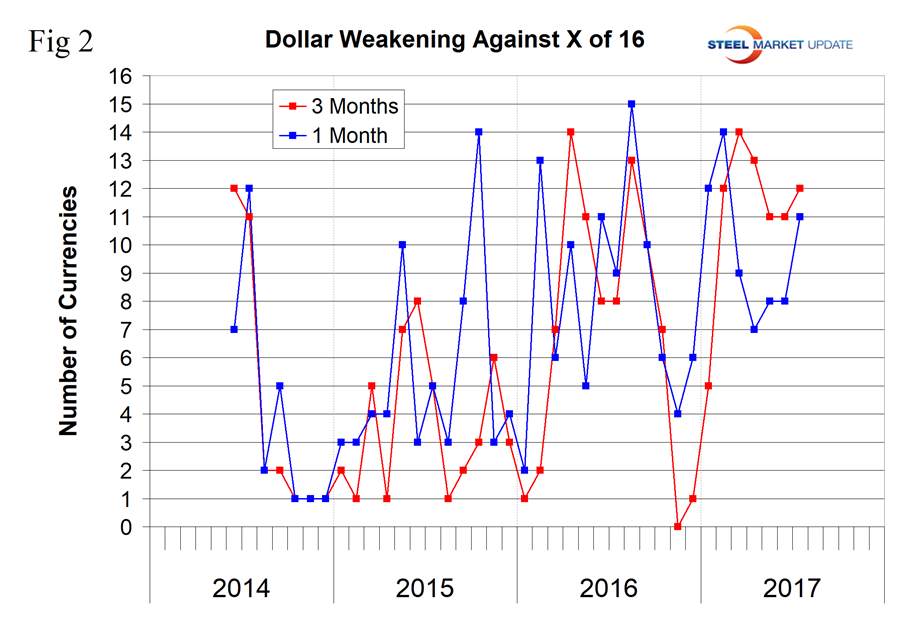
The Russian ruble was one of only four of the 16 to depreciate against the dollar in the last three months and it did so by the largest percentage of all. In three months, the ruble depreciated by 5.2 percent, and by 2.5 percent in one month, but appreciated by 2.4 percent in the last seven days (Figure 3).
On July 10, the IMF Executive Board concluded the 2017 Article IV consultation with the Russian Federation. They had this to say: “The Russian economy stabilized in 2016, contracting by just 0.2 percent of GDP, after being hit in 2014 by the dual shocks of lower oil prices and sanctions. The relatively modest reaction to the large external shocks reflects the authorities’ effective policy response—floating exchange rate, banking system liquidity support and capital injections, and limited fiscal stimulus coupled with restrictive incomes policies. The policy response was also enabled by robust buffers. The more stable oil prices and improved financial conditions will support a return to growth in 2017, with an expected increase in real GDP of 1.4 percent. Growth is forecast to continue at 1.4 percent in 2018. The still negative output gap, weak consumption demand, strengthening of the ruble and lower food prices from a bumper harvest are supporting the convergence of CPI inflation to the Central Bank target of 4 percent at end-2017. With adverse demographics, and barring significant structural reforms that lift productivity, potential growth is likely to stay at around 1.5 percent over the medium term. The main risk to the outlook remains a fall in oil prices.”
The Canadian Dollar
The Canadian dollar has strengthened against the U.S. dollar by 5.6 percent in three months and by 4.6 percent in 30 days (Figure 4).
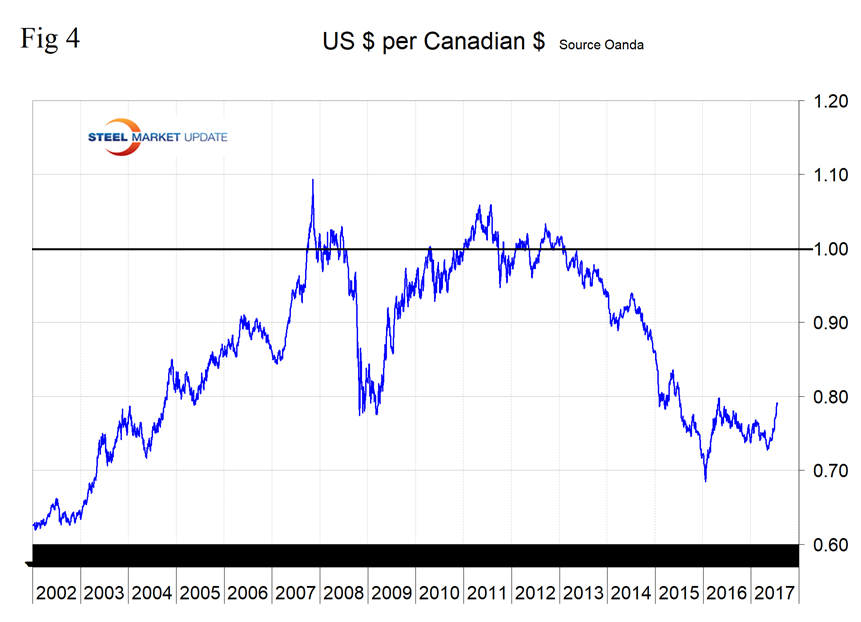
Alfonso Esparza, a macro commodities analyst, reported on July 17 that the loonie had a strong performance last week while the U.S. dollar retreated as U.S. data disappointed with slow inflation and falling retail sales. The Bank of Canada hiked rates for the first time in seven years, after switching the rhetoric in the past month. The market is still pricing in a second rate hike this year, but Canadian inflation and high levels of household debt could change the mind of the central bank.
On July 13, the IMF published their Executive Board Article IV consultation with Canada, which was summarized as follows: “The medium-term outlook is not upbeat because of structural impediments. Weak external competitiveness, low labor productivity growth, and population aging are expected to limit potential growth to about 1.8 percent, below the recent average of 2.6 percent. Risks to the outlook are significant. On the upside, stronger-than-expected growth in the U.S. could boost export and investment in the near term. On the downside, risks stem from several potential factors—including the risk of a sharp correction in the housing market, high uncertainty surrounding U.S. policies, or a further decline in oil prices—that can be mutually reinforcing. Policy choices will therefore be crucial in shaping the outlook and reducing risks.”
The Euro
The euro has strengthened against the dollar by 8.6 percent in three months, the most of any of the 16, and reached 1.545 U.S. dollars/euro on July 18 (Figure 5).
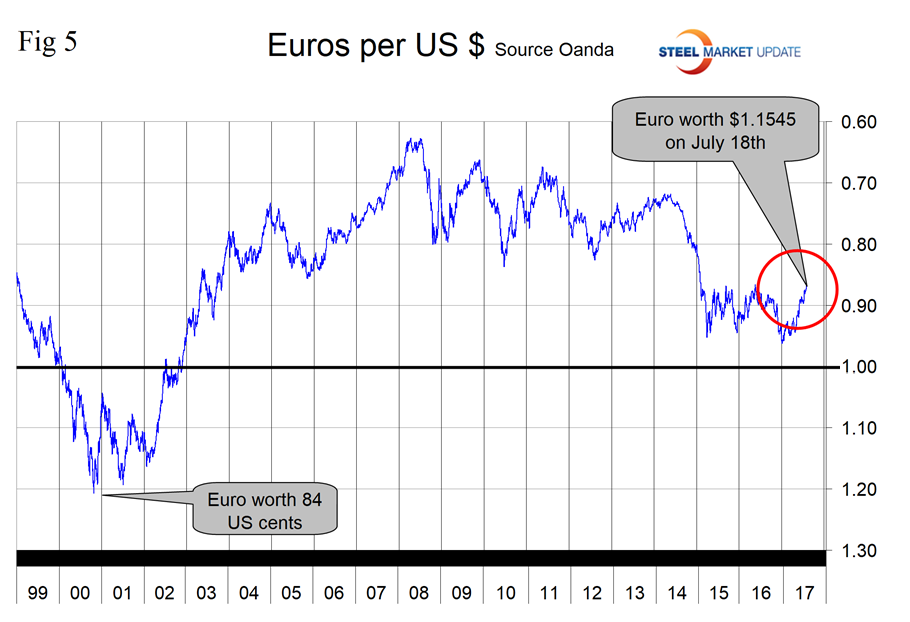
On the same day, Mark Chandler, an independent currency analyst, had this to say: “In the U.S., Yellen’s semi-annual testimony before Congress last week, disappointing U.S. inflation and consumption data, and now the collapse of the Senate’s effort to repeal and replace the Affordable Care Act, have influenced the plans of the European Central Bank. These developments are uniformly dollar negative. Last year’s euro high near $1.1615 is coming into view, and then the high from August 2015 near $1.1715 will be targeted. There continues to be interest in $1.20 strikes for 2-3 months.”
The British Pound
In the last three months, the pound has appreciated by 4.0 percent and by 2.1 percent in the last month (Figure 6).
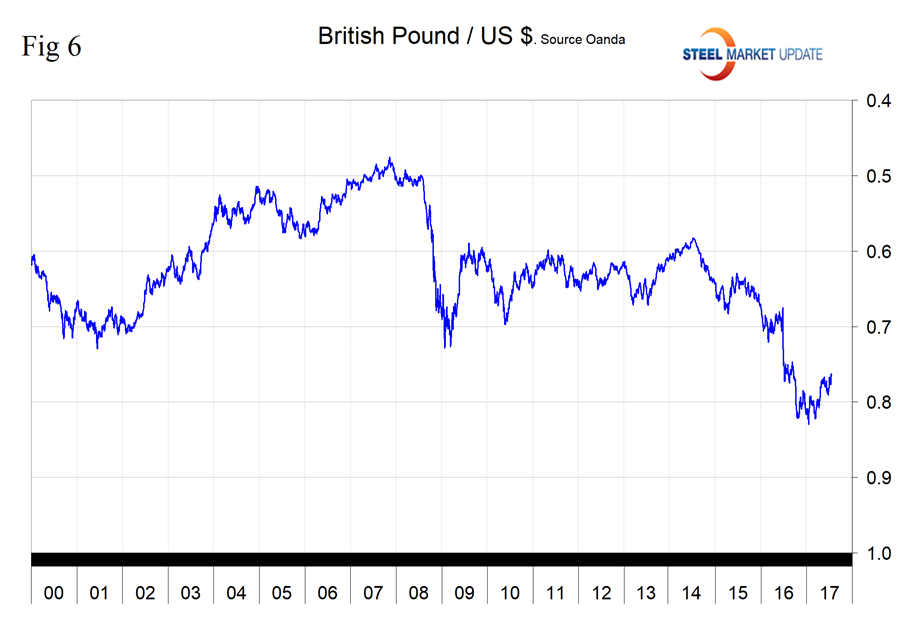
On July 18, it required 1.3054 U.S. dollars to buy one pound. On July 19, Mary Jane Fountain, an equites analyst, commented that despite George Soros’ comments about Brexit, there’s been very little negative reaction to the results from the last election. Despite a lot of media negativity, commercials (in this case banks) seem to be supporting a rise of the pound, which is already at extremely low (40 year) historical levels. Downside risk appears to be on the March low, which tested the January low, to a slightly higher, bullish level. A failure here warns of the possibility of testing the October 2016 low, Fountain said.
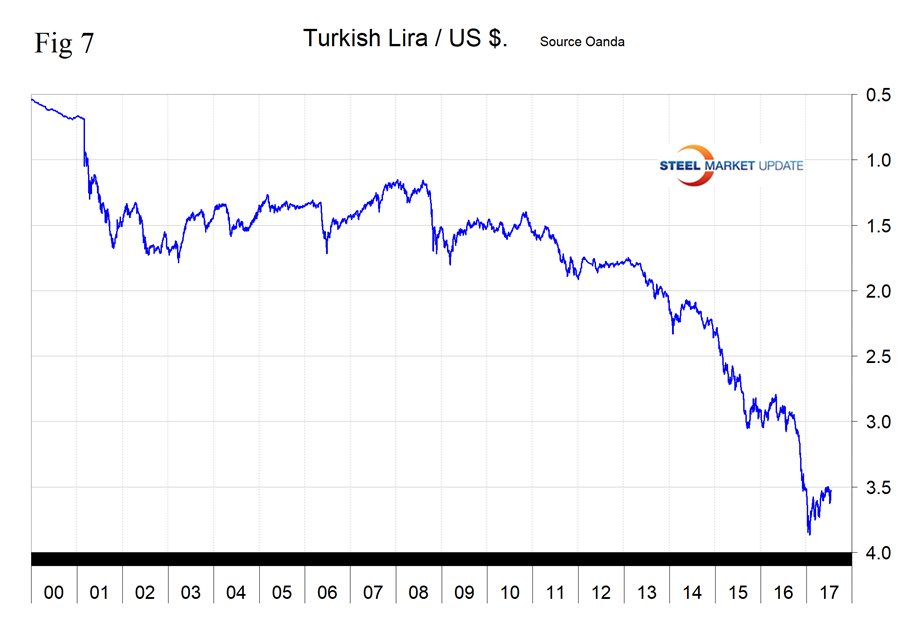
The Turkish Lira
We have found no external reports on the recent performance of the lira. Suffice it to say that this currency has appreciated by 4.6 percent against the dollar in three months and by 2.7 percent in seven days (Figure 7). The lira has appreciated by 9.6 percent since Jan. 11.
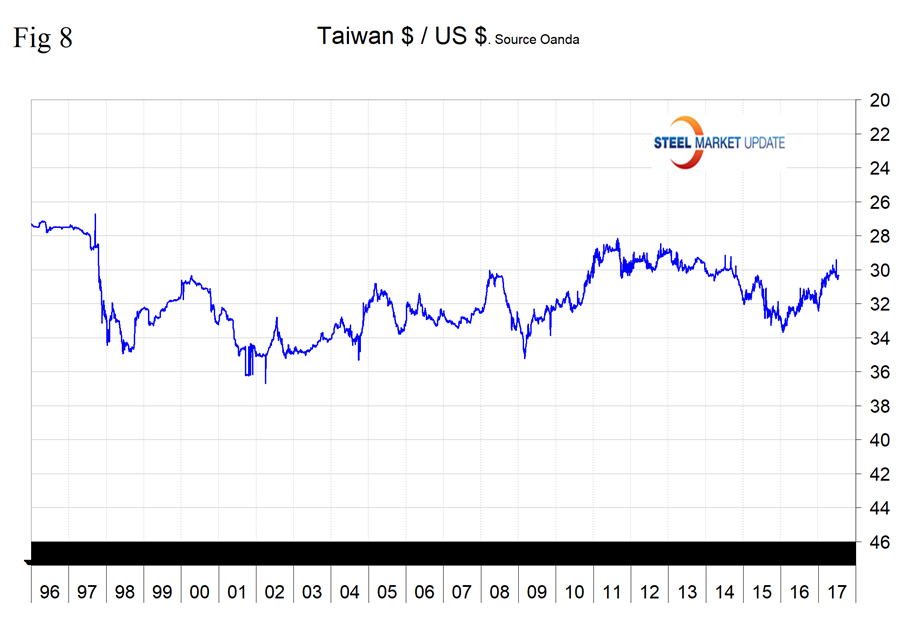
The Taiwanese Dollar
We also have no external commentary on this pair and have previously never reported on the Tai currency in this report. In the last three months, the Tai dollar has been the least changed of the 16 currencies under examination here with a decline of 0.04 percent, and an appreciation of 0.02 percent in one month (Figure 8).
Explanation of Data Sources: The broad index is published by the Federal Reserve on both a daily and monthly basis. It is a weighted average of the foreign exchange values of the U.S. dollar against the currencies of a large group of major U.S. trading partners. The index weights, which change over time, are derived from U.S. export shares and from U.S. and foreign import shares. The data are noon buying rates in New York for cable transfers payable in the listed currencies. At SMU, we use the historical exchange rates published in the Oanda Forex trading platform to track the currency value of the U.S. dollar against that of 16 steel trading nations. Oanda operates within the guidelines of six major regulatory authorities around the world and provides access to over 70 currency pairs. Approximately $4 trillion U.S. dollars are traded every day on foreign exchange markets.


