

Market Segment

July 19, 2017
MSCI Data Positive for June
Written by Peter Wright
The growth of service center shipments in June beat the average performance since 2009, according to data from the Metals Service Center Institute (MSCI). Inventories tend to be lower at mid-year, which is the case in 2017.
Daily shipments in June were 0.8 percent higher than in May. On average since 2009, June has decreased by 1.0 percent, therefore these latest numbers were a little better than normal for this time of year. Carbon steel shipments were 148,000 tons per day in June and months on hand on June 30 were 2.09, up from 2.05 at the end of May.
Intake and Shipments
In June, total carbon steel intake at 149,100 tons per day (t/d) was 1,100 tons more than shipments. This was the first month of surplus after three months of deficit. Total sheet products had an intake surplus of 400 tons. This was the second month of surplus after three successive months of deficit.
Total daily carbon steel shipments decreased from 148,500 tons in May to 148,000 tons in June. MSCI data is quite seasonal and we need to eliminate that effect before commenting in detail on an individual month’s result. Figure 1 demonstrates this seasonality and why comparing a month’s performance with the previous month can be misleading, particularly in January and the second half of the year.
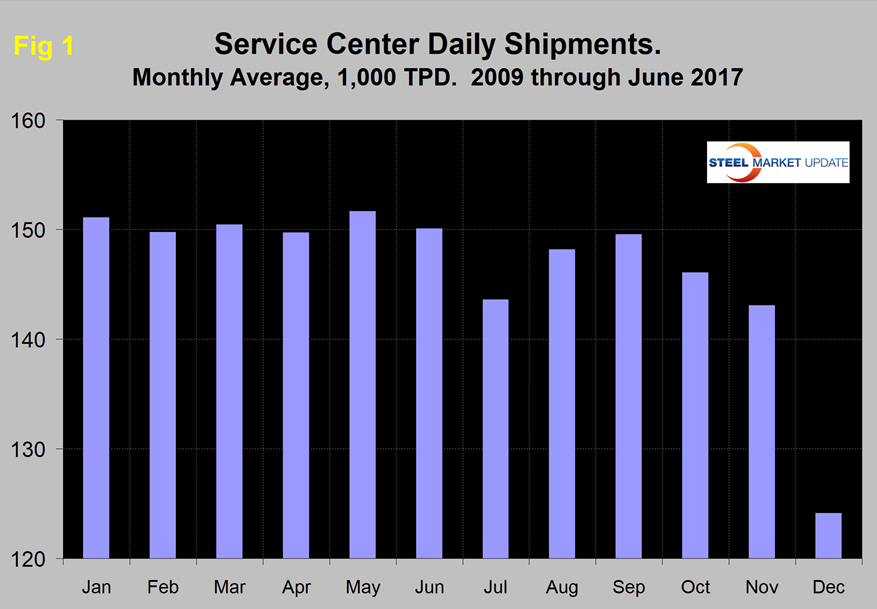
We can expect shipments to be down by about 4.0 percent in July. In the analysis described below, we report year-over-year (y/y) changes to eliminate seasonality. Our intention is to provide an undistorted view of market direction.
Table 1 shows the performance by product in June compared to the same month last year, and also with the average daily shipments for this and the two previous months of June.
We then calculate the percent change between June 2017 and June 2016 and with the most recent three-year June average. June this year was up by 1.2 percent from June 2016, but down by 1.1 percent from the three-year June average. The fact that the year-over-year growth comparison is better than the three-year comparison suggests that momentum is positive.
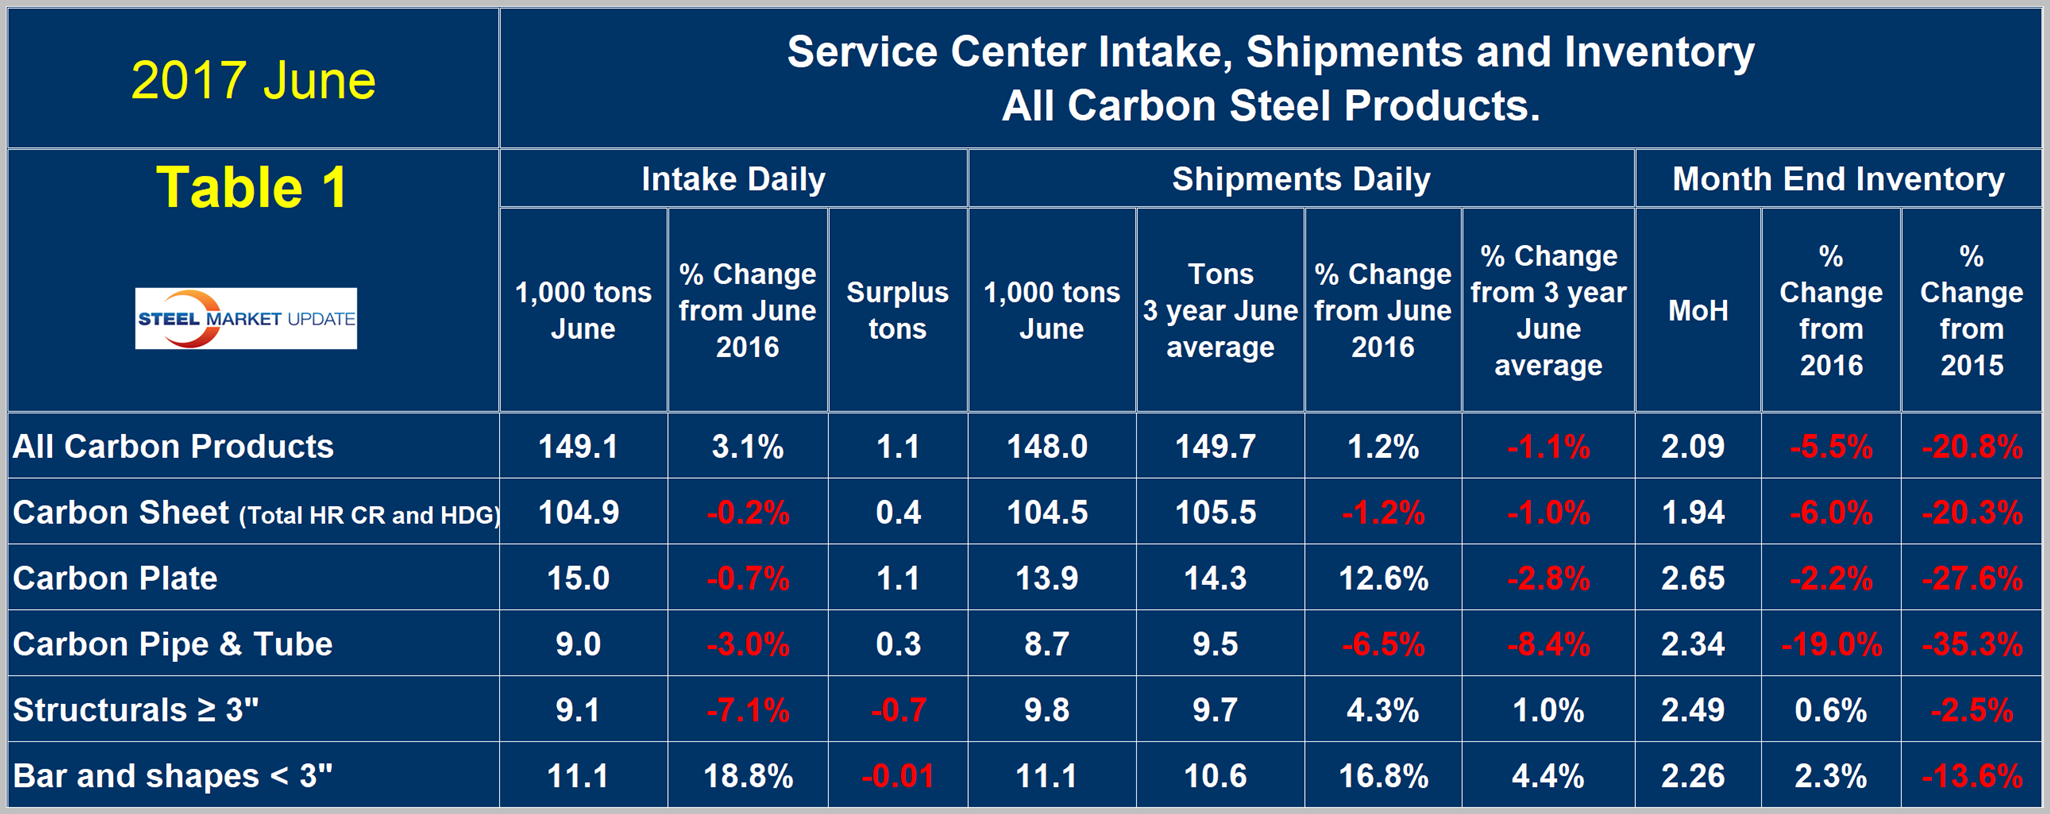
Shipments of plate and long products were up from June last year, but sheet and tubulars were down. Figure 2 shows the long-term trend of daily carbon steel shipments since 2000 as three-month moving averages. (In our opinion, the quickest way to size up the market is the brown bars in Figures 2, 3, 4 and 5, which show the percentage y/y change in shipments.)
In January, on a 3MMA basis, there was positive y/y growth of 0.07 percent, which improved to 6.2 percent in April before declining to positive 3.2 percent in June. These were the first positive y/y results since June 2015.
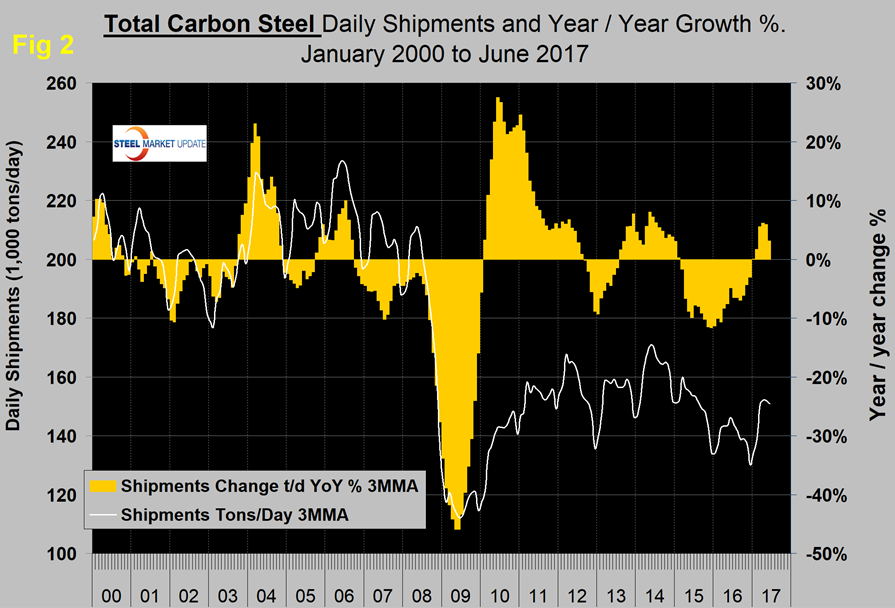
Figure 3 shows monthly long product shipments from service centers as a 3MMA with y/y change.
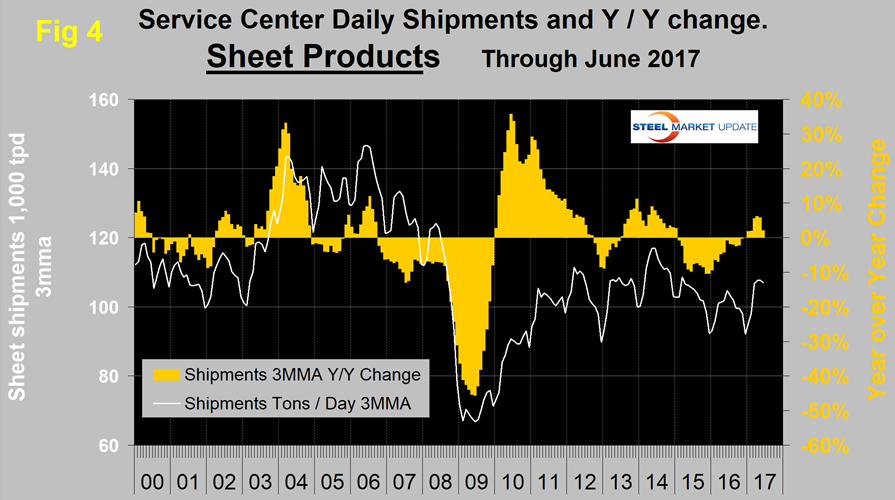
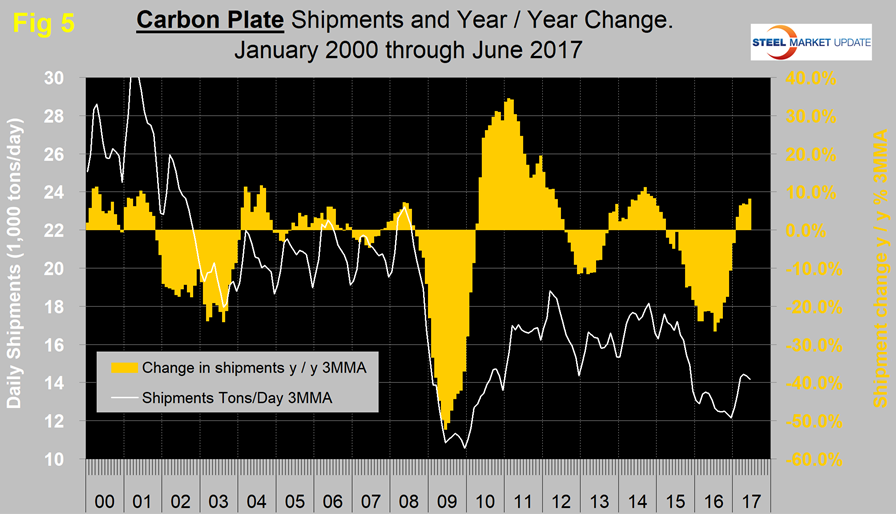
Growth has improved this year and is now the highest it has been since early 2011. February through June were the first months with positive growth in two years. Sheet and plate have performed very differently in the last two years. Sheet and plate products both had a good post-recession recovery. Both had some contraction in 2013 and growth in 2014, but from early 2015 through the end of 2016 they diverged dramatically with plate performing much worse than sheet. This year plate has begun to close the gap. Figures 4 and 5 show the 3MMA of daily shipments and the y/y growth for sheet and plate, respectively.
In 2006 and 2007, the mills and service centers were operating at maximum capacity. Figure 6 takes the monthly shipments by product and indexes them to the average for 2006 and 2007 in order to measure the extent to which shipments of each product have recovered.
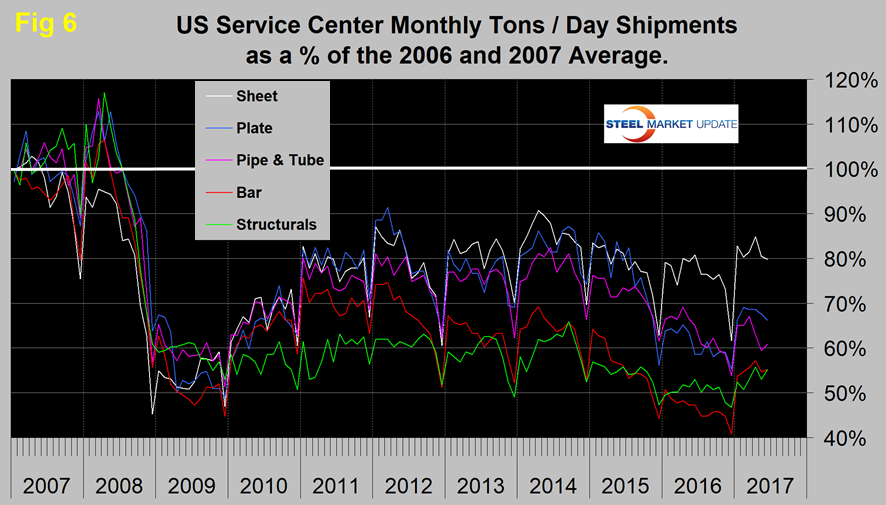
Each year, all products experience the December collapse and January pick-up. In June, the total of carbon steel products was 69.7 percent of the shipping rate that existed in 2006 and 2007. Structurals and bar were both at 55.2 percent, sheet was at 79.8 percent, plate at 66.2 percent and tubulars at 60.8 percent.
Inventories
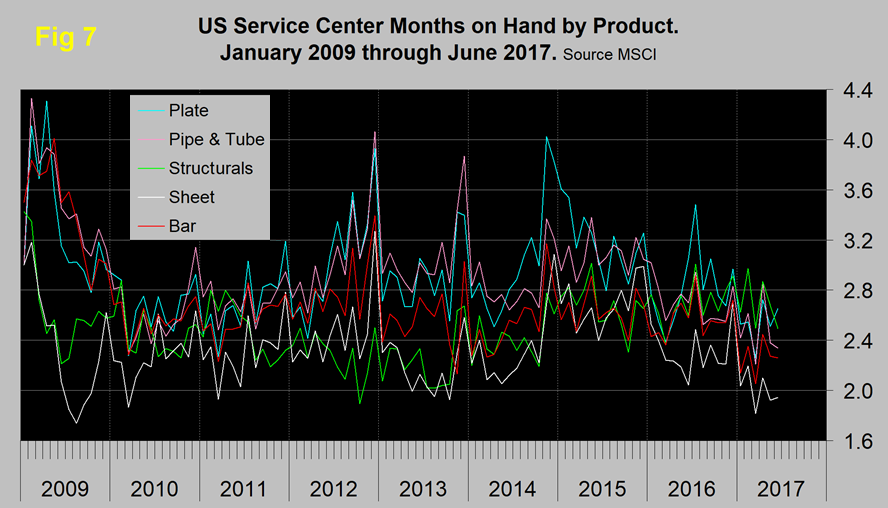
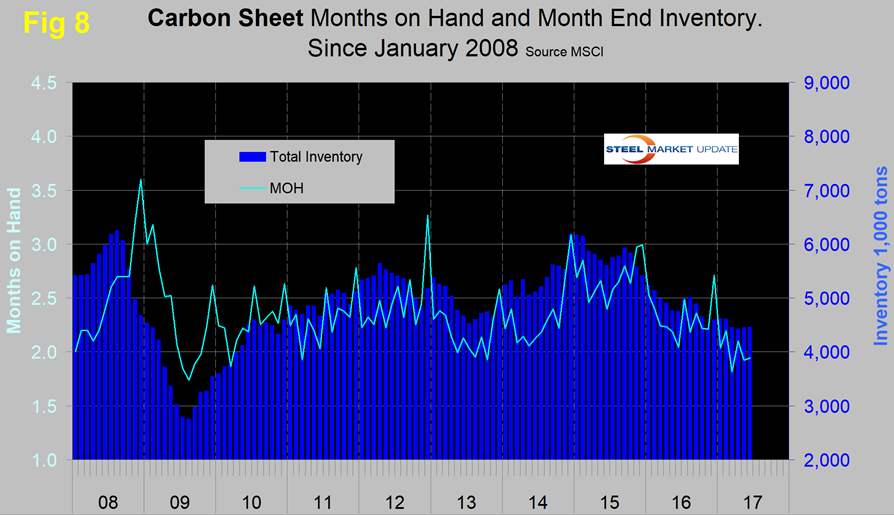
March closed with months on hand (MoH) of 1.94 for all carbon steel products, which was the lowest level in 13 years (since June 2004). April increased to 2.28, and May and June declined to 2.05 and 2.09, respectively. This calculation is misleading because it is based on total shipments for the month. Therefore, it is highly influenced by the number of shipping days. The March MoH was so low because shipping days were at the maximum. Compared to June last year, MoH in total were down by 5.5 percent, led by pipe and tube products, which were down by 19 percent, and sheet products, down by 6.0 percent. Long products had an increase in MoH year over year. Sheet, plate and tubulars all experienced a decrease. There were the same number of shipping days in June 2016 and June 2017, both with 22 days. Figure 7 shows the MoH by product monthly since June 2009.
All products had a surge in months on hand in July 2016, driven not by an inventory volume increase but by a decrease in monthly shipments as a result of a small number of shipping days. By the same token, the low MoH in March was influenced by the high number of shipping days. Figure 8 shows both the month-end inventory and months on hand since June 2008 for total sheet products. The total inventory tonnage of sheet products has been in decline since the end of 2015.
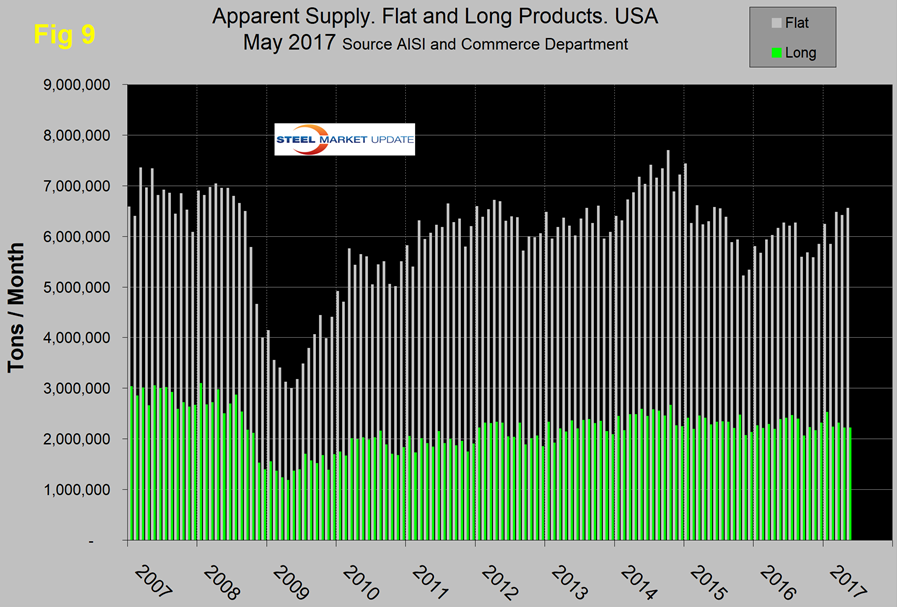
SMU Comment: In Figures 2, 3, 4 and 5, the white lines show t/d shipments. So far in 2017, the MSCI results have been encouraging. There was a decline in shipments for total carbon steel products from mid-2014 through December last year, but the y/y comparison became positive in 2017. Figure 9 shows the total supply to the market of long and flat products based on AISI shipment and import data through May, which is the latest data available. Total supply of long products is much better than the MSCI report of service center shipments with a volume almost double the recessionary low point. For flat rolled, the MSCI and AISI data have been in reasonable agreement.
The SMU data base contains many more product specific charts than can be shown in this brief review. For each product, we have 10-year charts for shipments, intake, inventory tonnage and months on hand. Some readers have requested these extra charts for a particular product, and others are welcome to do so.


