Product

August 2, 2017
Raw Material Prices Advance
Written by Peter Wright
In this report, updated July 28, we examine the latest prices for iron ore, scrap, coking coal and zinc.
To put the raw materials analysis into perspective, we begin with Figure 1, which shows the spread between Chicago #1 busheling and hot rolled coil ex works Indiana through July 21, both in $/net ton.
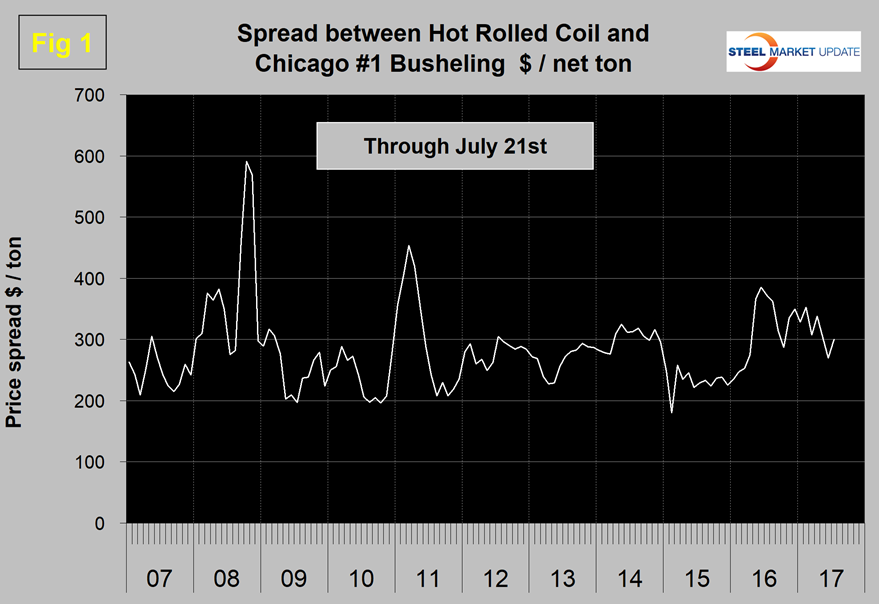
On this date, Chicago busheling was priced at $316.96/net ton ($355.00/gross ton) and HRC ex works Indiana was $617.00/net ton for a spread of $300.04/net ton. The spread reached a 2016 high of $385.46 in June last year.
Scrap
Figure 2 shows the relationship between shredded and #1 busheling, both priced in Chicago.
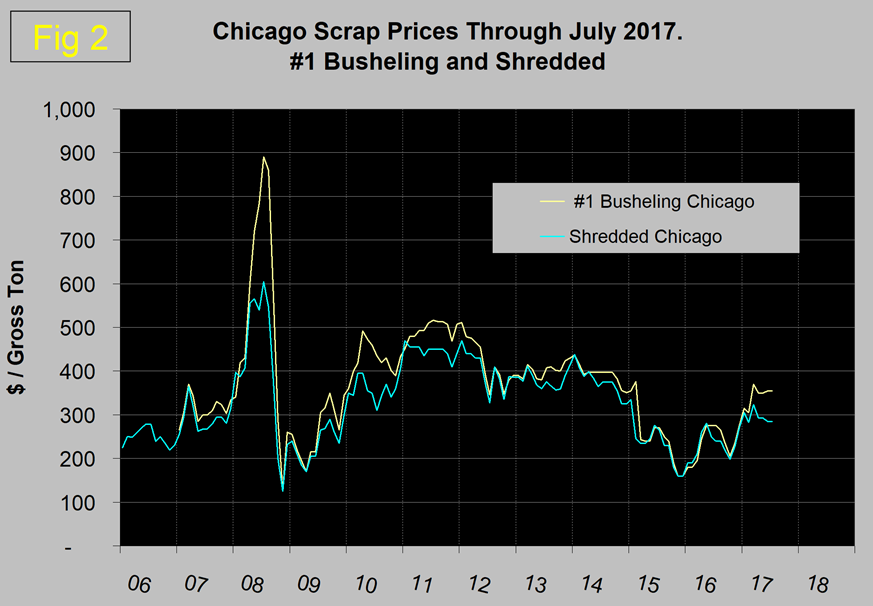
In July, Chicago prices were unchanged from June at shredded $285 and busheling $355, both/gross ton. This is the highest premium for busheling since February 2015.
Historically, there has been a close non-causal relationship between the price of scrap and the price of oil. Figure 3 shows the scrap/oil relationship through July 24 with the oil price obtained from the U.S.
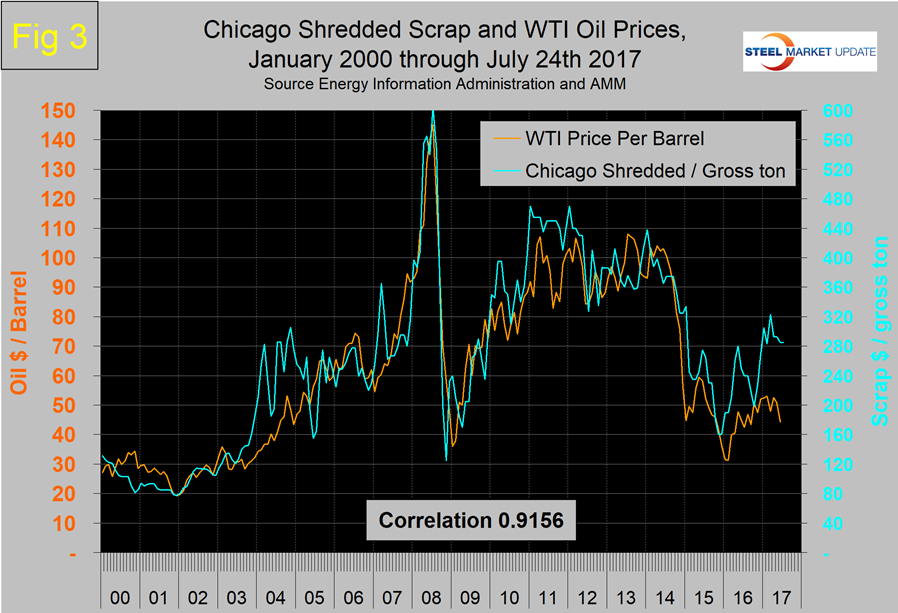
Energy Information Administration. The scrap to oil price correlation is 0.9156 since January 2000 and 0.9330 in the 27 years since January 1990. The relationship is currently telling us nothing about the future price of scrap, but we keep reporting it because, based on history, we believe the time will come when this is once again very predictive of scrap prices. The other two occasions when this relationship failed were 2004 and 2011 for reasons that were well understood at those times.
Iron Ore
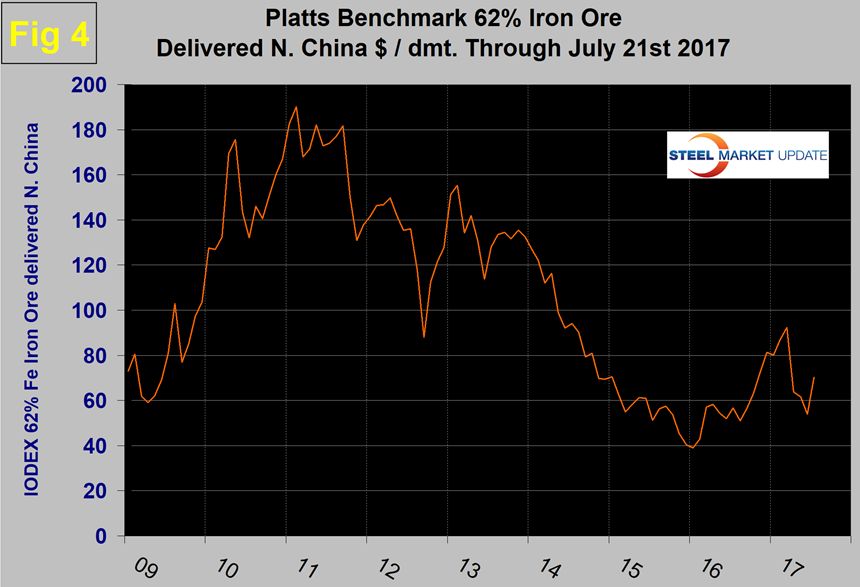
The Platts IODEX of 62 percent Fe delivered North China fell below $40 in January this year, then recovered to $92.30 on March 17. The price declined once again to $54.00 on June 9 and recovered to $70.20 on July 21 (Figure 4).
There is a long-term relationship between the prices of iron ore and scrap. Figure 5 shows the IODEX and the price of Chicago shredded through July 21.
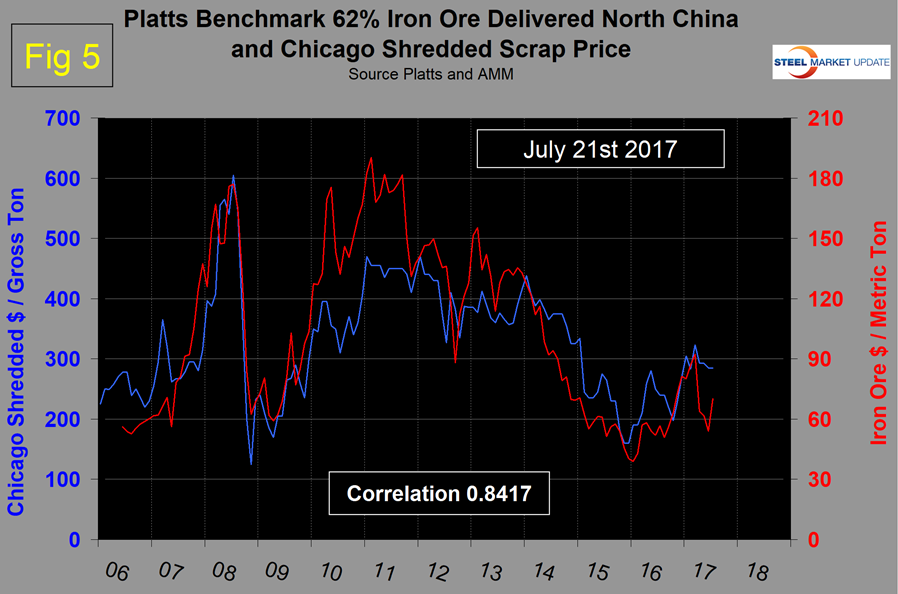
The correlation since January 2006 has been 84.17 percent, and in the last 10 years on average, scrap in $/gross ton has been 3.4x as expensive as ore in $/dmt. The ratio has been erratic since mid-2014, but overall since then has benefited the integrated producers. There was a six-month respite for the EAF operators in Q4 ’16 and Q1 ’17, but now the ratio is once again high with a value of 4.06 on July 21. The June ratio of 5.28 was the highest in over 10 years (Figure 6).
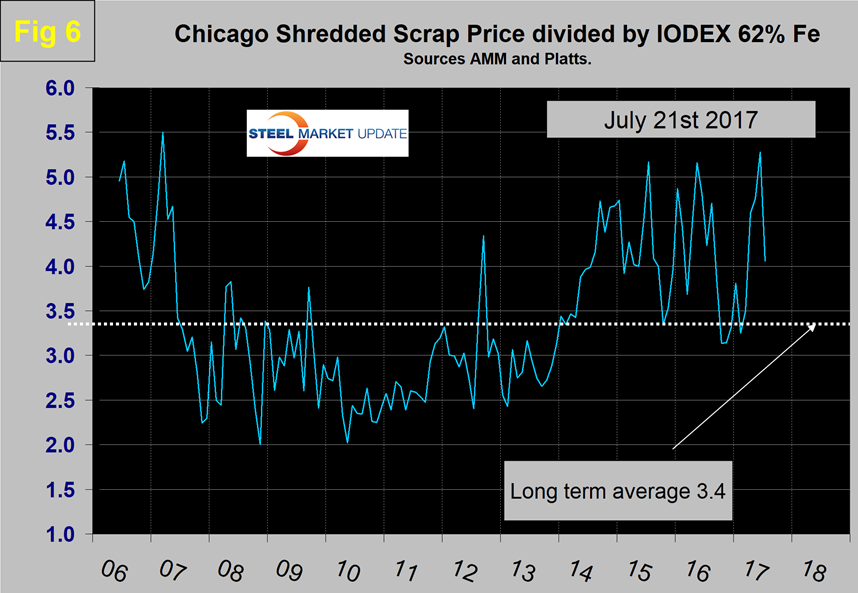
Since Chinese steel manufacture is 93 percent BOF, this ratio has played in their favor in the last three years, and as well as the obvious advantage has allowed them to supply semi-finished to the global market at prices competitive with scrap.
Coking Coal
The price FOB East Australian ports shot up in April to $370 as Cyclone Debbie disrupted shipments from the East Coast of Australia (Figure 7).
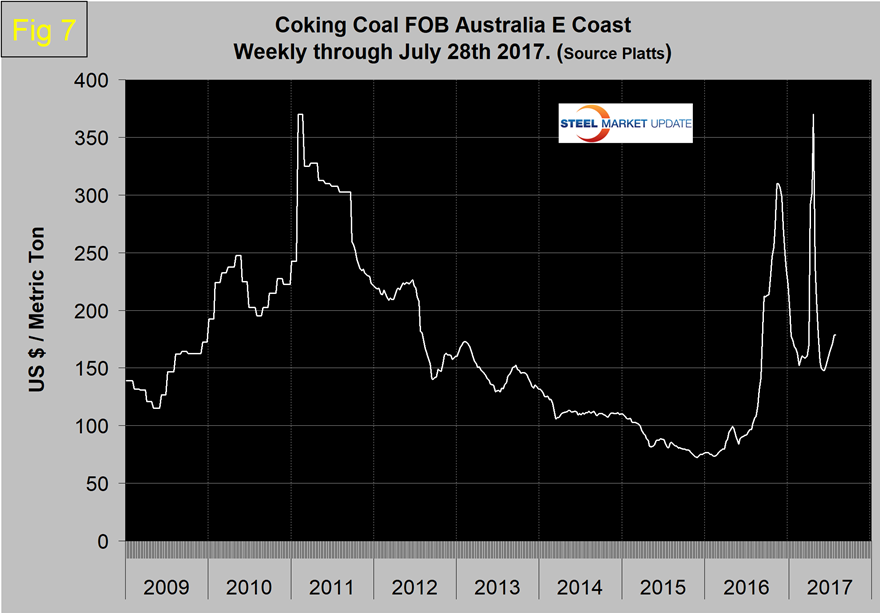
Through July 12, the price had declined to $147.90/metric ton and had recovered to $178.50 on July 28. In June, Platts reported that coking coal spot markets continue to return to normality after the impact of Cyclone Debbie, with exports from Australia recovering. Market participants are unsure about the future price direction with some believing prices were abnormally high even before cyclone Debbie hit in late March.
Zinc
The major use of zinc is for galvanizing. Other significant uses include the alloying of brass and bronze and in zinc-based alloys used in the die-casting industry. Kitco publish a daily spot price of zinc, which we have transcribed to Figure 8.
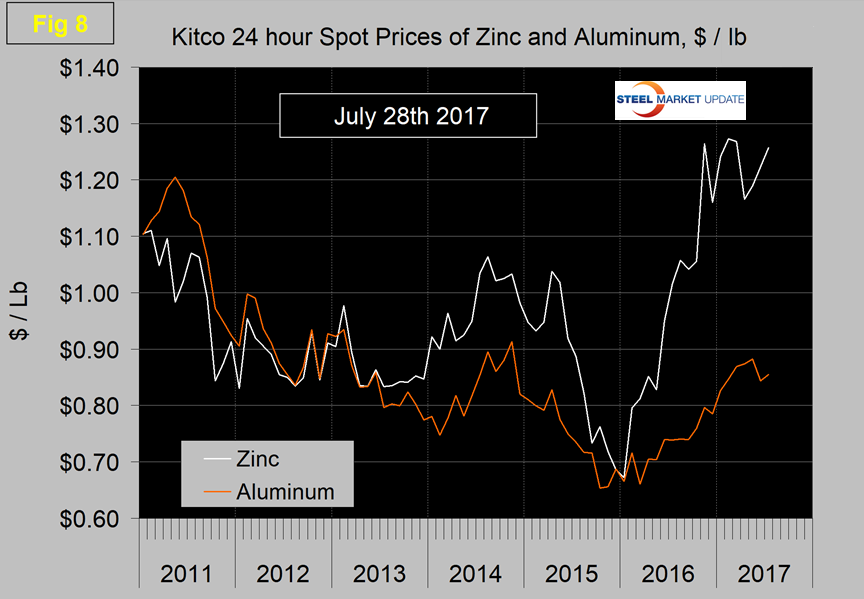
Just as a point of reference, we have included aluminum in the same graph. The price of zinc slid precipitously to $0.6723/pound in January of 2016, then recovered to $1.2642 in November 2016. Since then the price has been erratic, ranging between $1.1603 and $1.2730. On July 28, the price was $1.2575/pound. Aluminum has risen much less than zinc this year with a spot price of 0.8549 on the 28th.
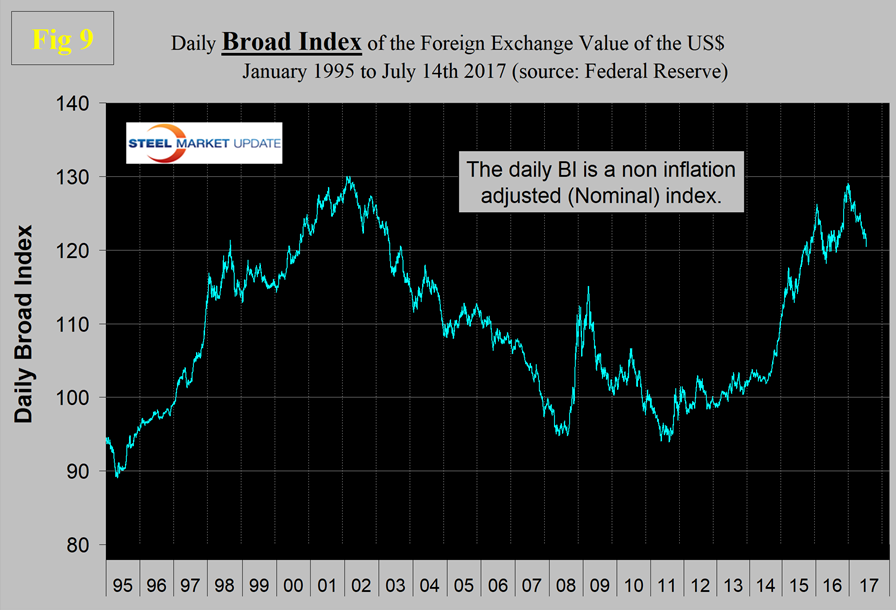
SMU Comment: The prices of raw materials are driven by normal supply and demand forces and also by unexpected events such as cyclone Debbie that hit the supply side of the coke equation. However, behind the scenes there is an inverse relationship between commodity prices and the value of the U.S. dollar on the global currency markets. As we reported in our currency update last week, the value of the dollar declined by 7.0 percent between Jan. 3 and July 14 this year and in the first two weeks of July declined by 1.3 percent (Figure 9). A weakening dollar will put upward pressure on the price of those global commodities that are priced in dollars.