

Market Data

August 18, 2017
Oil and Gas Rig Count Declines
Written by Peter Wright
In the last month, the price of crude oil has risen and the price of natural gas has declined slightly. The number of operating rigs exploring for both oil and gas has declined for three straight weeks. This is the first decline since the low point of June 27 last year. The prices of oil and natural gas drive the consumption of energy-related steel products including oil country tubular goods, pipe fittings and well head equipment, among others. A significant volume of hot rolled coil is used to make welded tubular goods.
Figure 1 shows historical oil and gas prices since January 2000.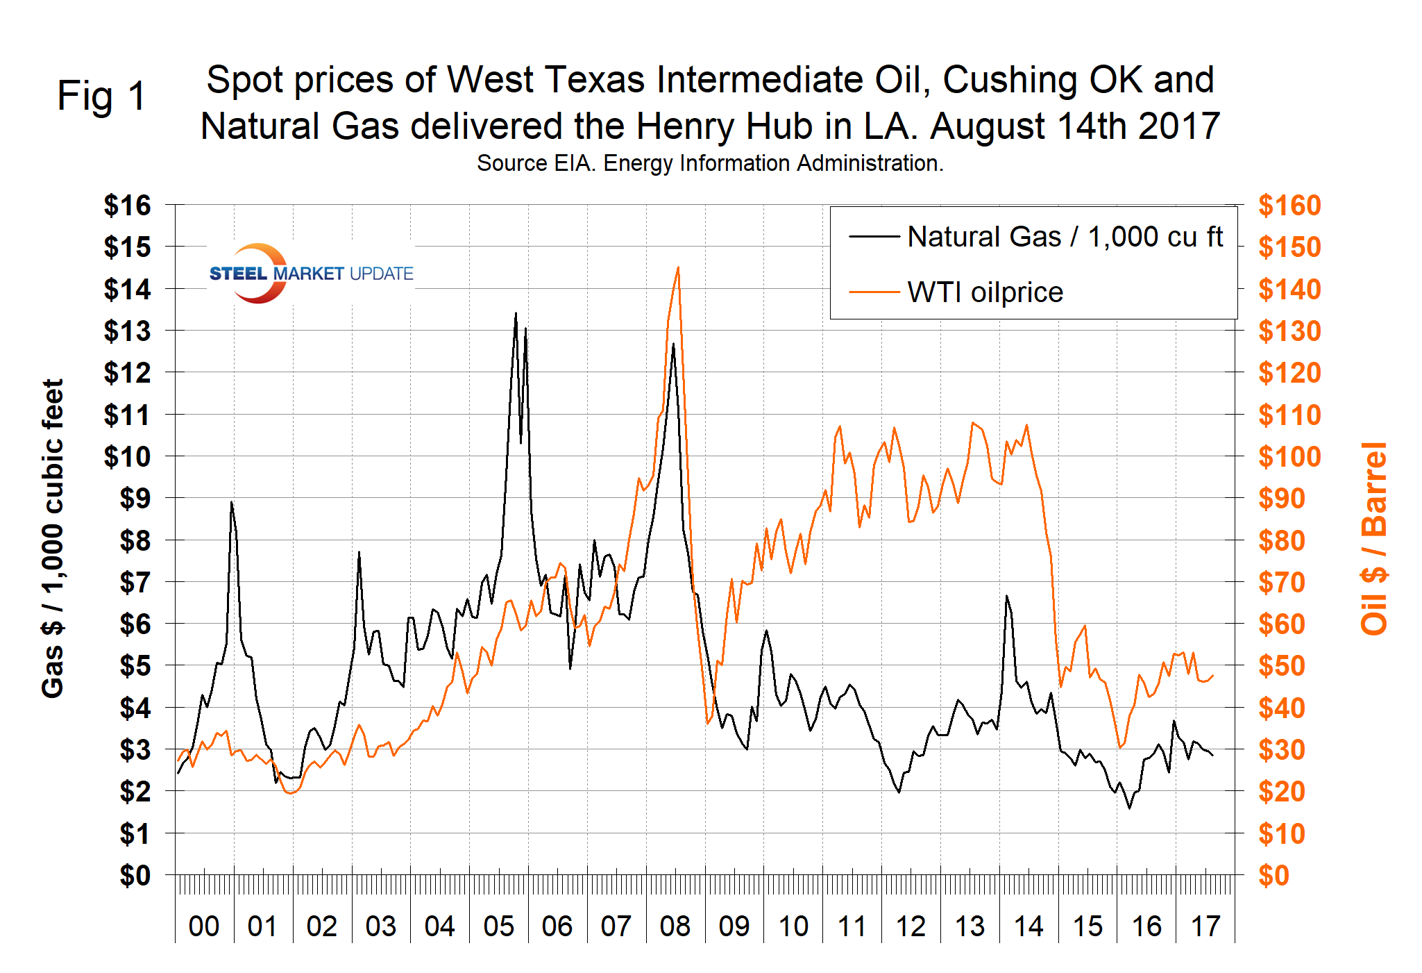
On June 6, 2016, the daily spot price of West Texas Intermediate (WTI) rose through $50 for the first time in 12 months. Since then the price has ranged between a low of $40.05 in August last year and a high of $54.00 in February this year. Except for one day, July 31, the price has not exceeded $50 since May 24 this year. WTI spot on Aug. 14 was $47.59, up from $44.40 in our July 16 report. The price of oil has gone nowhere in over a year.
Our price and inventory data comes from the Energy Information Administration (EIA). Weekly U.S. stocks of crude oil, including the strategic petroleum reserve, declined for 18 of the last 19 weeks. The decline is now much more than normal seasonality. Stocks on Aug. 11 were 4,182,000 barrels lower than at the same time last year, but are still well above the historical norm (Figure 2).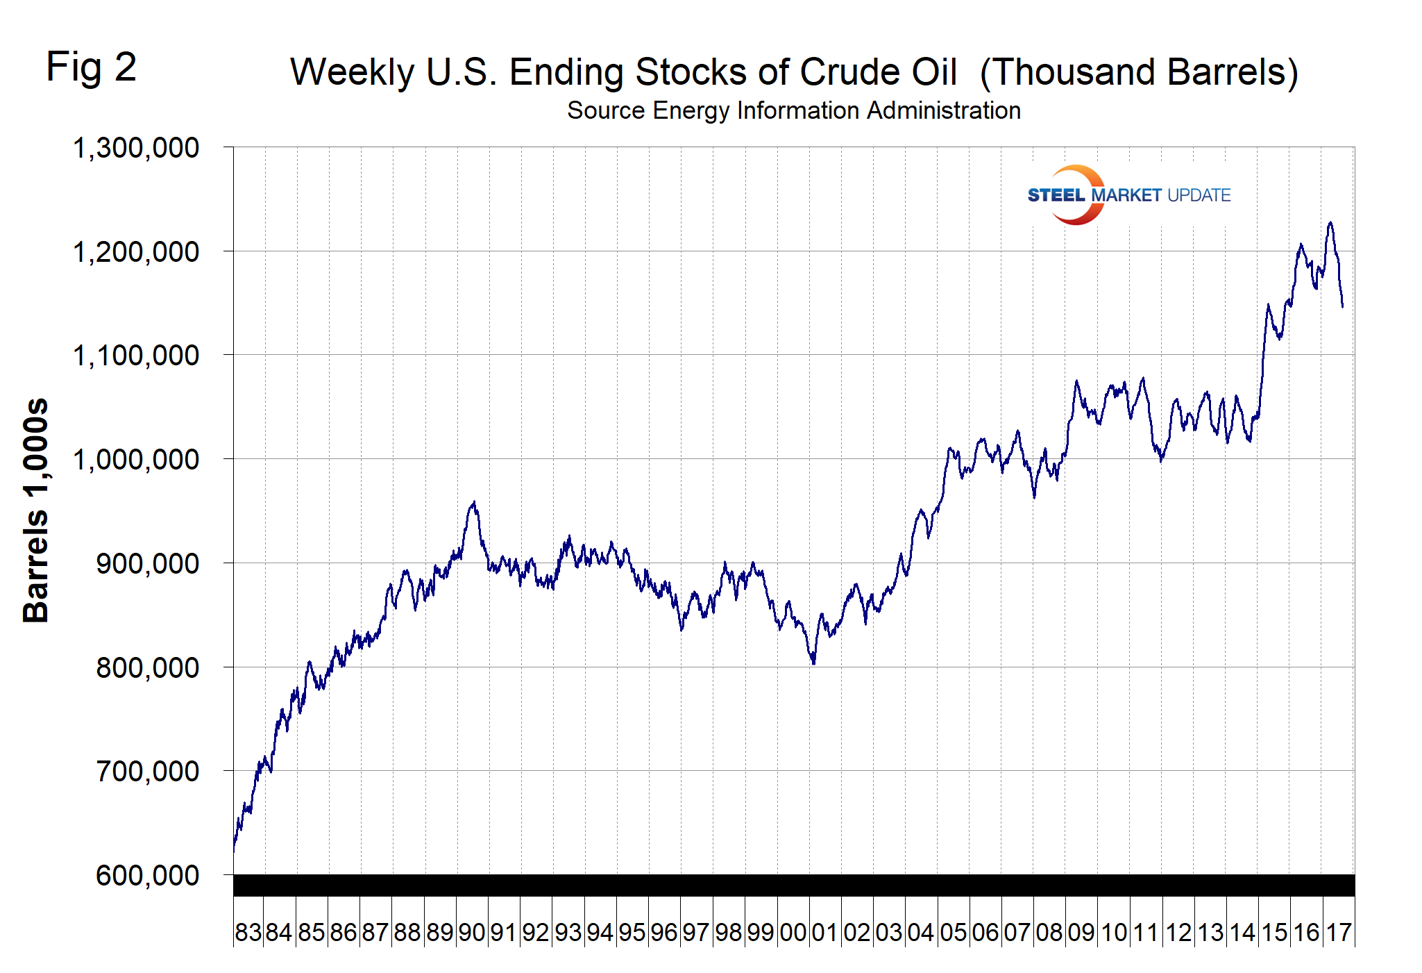 The price of natural gas on Aug. 11 at the Henry Hub in Louisiana was $2.85 per 1,000 cu. ft. This was 10 cents lower than in our last update. After a brief surge to $3.68 on Dec. 9 last year, the price is now the same as it was on July 24 two years ago.
On Aug. 14, commodities analyst Andrew Hecht expressed optimism. He wrote: “The supply and demand equation for natural gas has improved dramatically over the past year. The energy commodity traded to the lowest level since the late 1990s in March 2016 when the price hit lows of $1.611 per MMBtu. Massive discoveries of natural gas in the Marcellus and Utica shale regions of the United States weighed on the price, and temperate weather conditions during the winter season did not help matters. However, the switch from coal to natural gas in power generation, and the technological advances that allow for liquefaction of natural gas, have increased the demand side of the fundamental equation for the energy commodity. LNG is a new opportunity for natural gas that has expanded the addressable market. Exports are now able to travel the world by ocean vessel. On paper, natural gas looks great these days. Aside from increasing demand, inventory injections over recent weeks have been so low that it is starting to look like we will go into the winter season with the lowest stock level in years. Meanwhile, the price action in the natural gas market had been bearish as the price was making lower highs and lower lows since May. Last Thursday, the market may have finally opened its eyes to the possibility that higher prices are on the horizon over coming months.”
The total number of operating rigs in the U.S. on Aug. 18 was 946, which was a decrease from 952 in our last report. The number of operating rigs has declined for each of the last three weeks after rising steadily from a low point of 404 on June 27, 2016. The oil rig count had a low point of 316 also on June 27 last year, rose to 768 on Aug. 11 and declined to 763 on Aug. 18. The U.S. gas rig count rose from its low point of 81 on Aug. 5 last year to 192 on July 28. In the last three weeks, there was a decline of 10 active rigs to 182. The year-over-year growth rate of U.S. plus Canadian total rigs was 90.0 percent in the latest data. Figure 3 shows the Baker Hughes U.S. Rotary Rig Counts for oil and gas equipment in the U.S.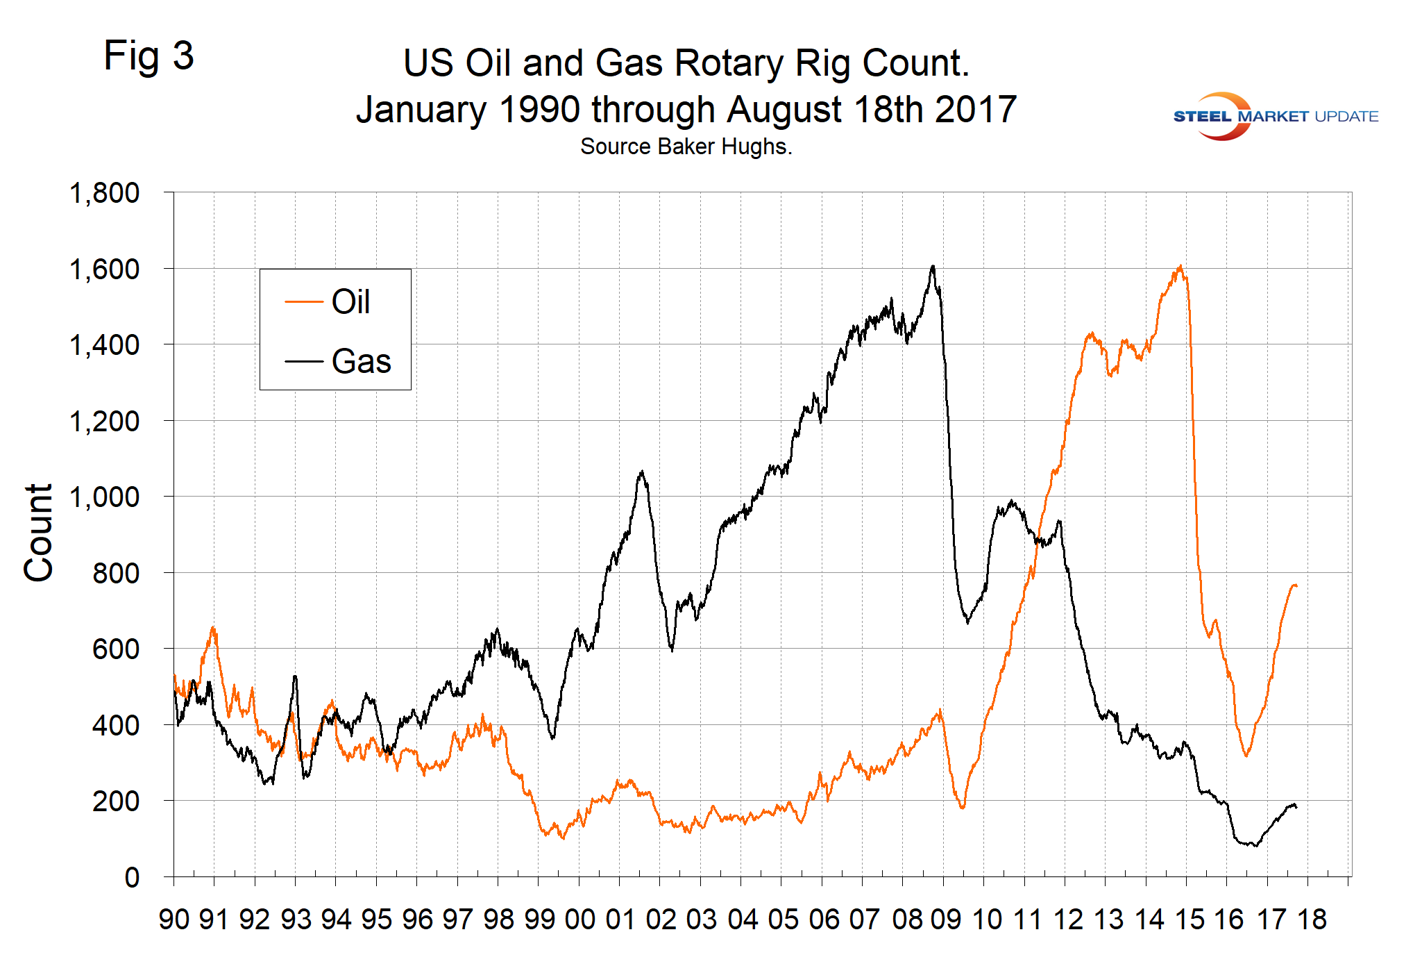 On a regional basis in the U.S., the big three states for operating rigs are Texas, Oklahoma and North Dakota. Figure 4 shows the land rig count in those states since 2000.
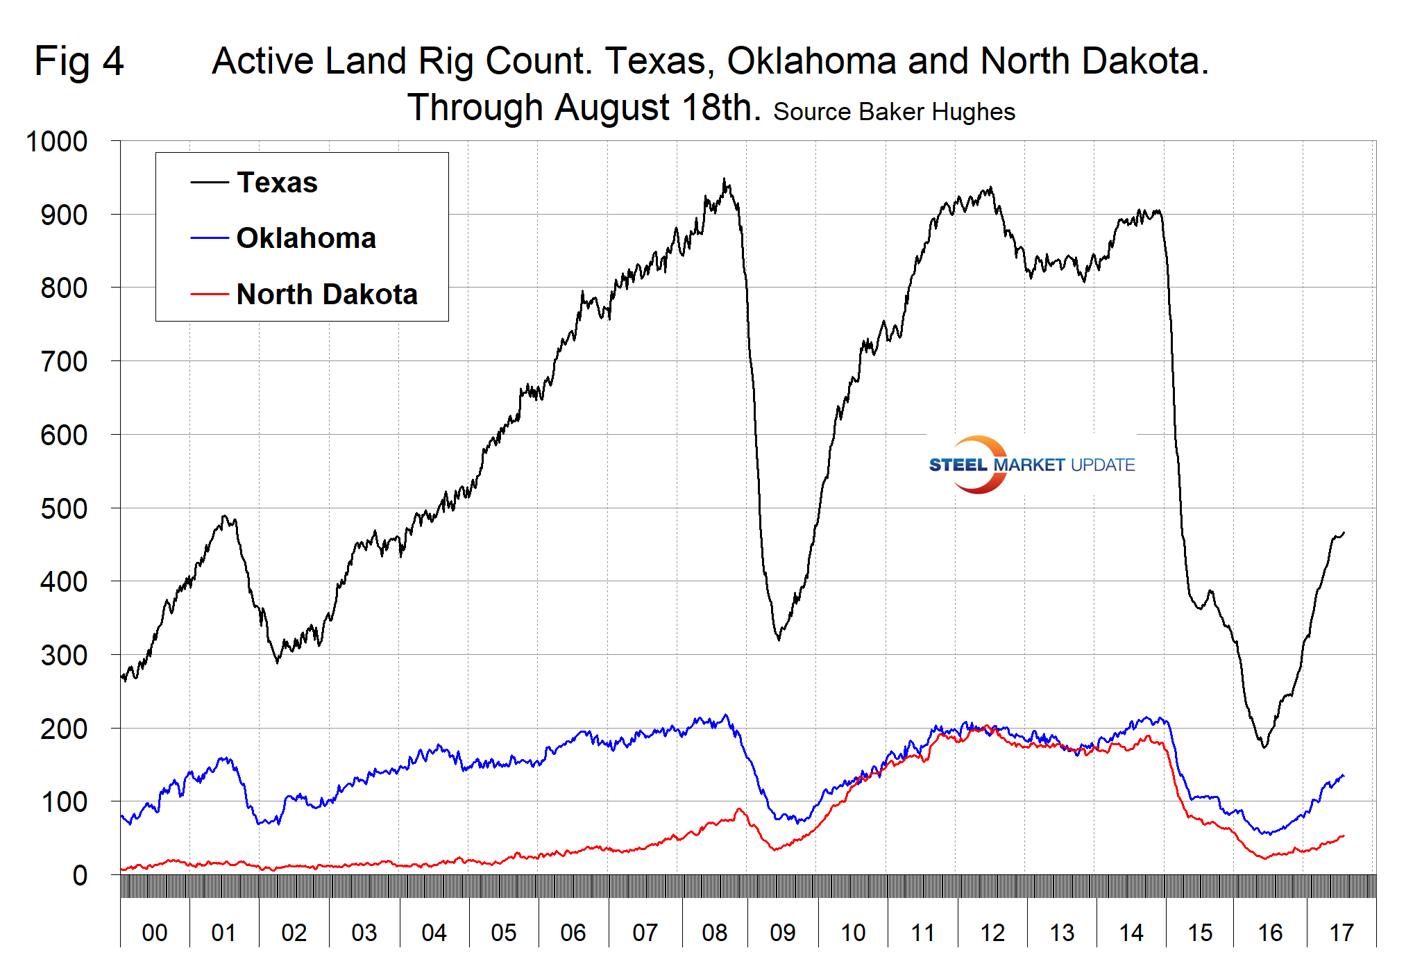 Figure 4 also shows that non-conventional drilling in North Dakota was down by 73 percent from its heyday in late 2014. This is not as bad as it sounds because previously drilled and capped wells are being put back on stream. The Dakota Access Pipeline is open for business. Bakken oil producers now have the ability to ship 520,000 barrels per day by pipeline rather than by rail to the hub near Patoka, Ill., where refiners in the Midwest can access the crude. An additional option is to ship to the hub near Nederland, Texas.
The Baker Hughes rotary rig count is a weekly census of the number of drilling rigs actively exploring for or developing oil or natural gas in the United States. Rigs are considered active from the time they break ground until the time they reach their target depth and may be establishing a new well or sidetracking an existing one. The Baker Hughes Rotary Rig count includes only those rigs that are significant consumers of oilfield services and supplies.


