

Market Data

September 15, 2017
BLS: Producer Prices Increase in November
Written by Peter Wright
The Producer Price Index of commodities increased by 3.1 percent for the 12 months ended in November, according to data released Thursday by the Bureau of Labor Statistics—the largest advance since the 12 months ending January 2012.
On Thursday, the BLS released its series of producer price indexes (PPIs) for more than 10,000 goods and materials. (For an explanation of this program, see the end of this piece.) The latest release reported results through November. We run this analysis every three or four months to provide information for subscribers on any changes in the competitive position of steel against other materials and rail vs. truck transportation. The PPI data are helpful in monitoring the price direction of steel and steel products against competing materials and products. As far as we can tell from comparison with known transaction prices, these PPI are a reasonable representation of the real world, though there may be a lag between the BLS reports and spot prices for steel products. We have also concluded that the actual index values of the PPIs of different products cannot be compared with one another because they are developed by different committees within the BLS. We believe this data is useful in comparing the direction of prices in the short and medium term, but not the absolute value.
An abridged version of the November report from the BLS is as follows: “The Producer Price Index for final demand increased 0.4 percent in November. On an unadjusted basis, the final demand index rose 3.1 percent for the 12 months ended in November, the largest advance since the 12-month period ending in January 2012. In November, three-fourths of the rise in the final demand index is attributable to a 1.0 percent increase in prices for final demand goods. The index for final demand services climbed 0.2 percent. For the 12 months ended in November, prices for final demand, less foods, energy and trade services, moved up 2.4 percent.”
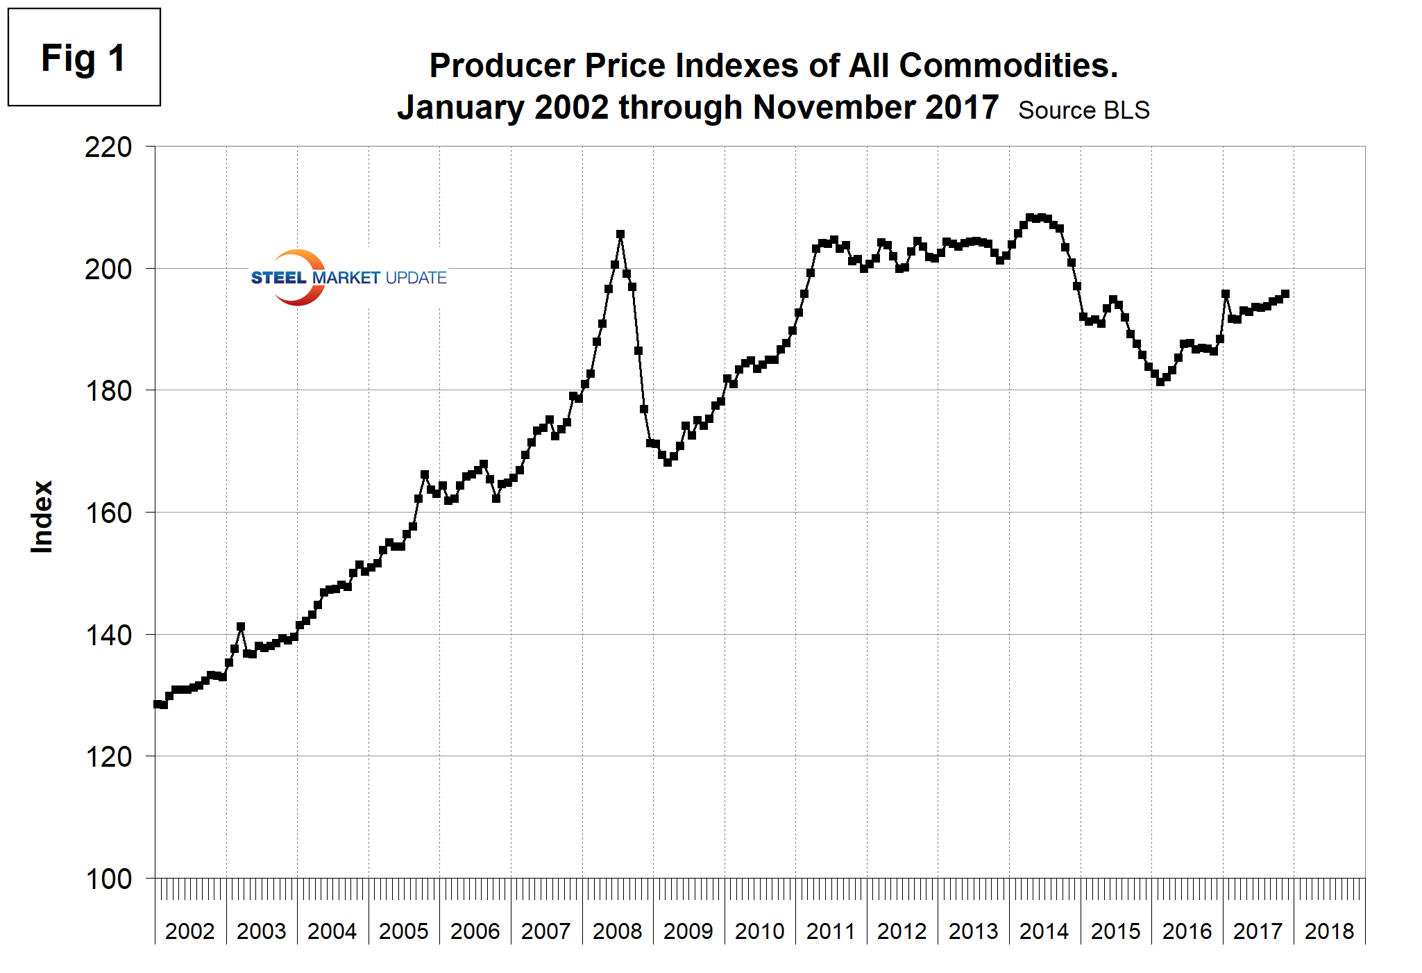
Figure 1 shows the composite PPI of all commodities since January 2002. For this report, we have extracted comparative statistics for sheet steel, aluminum and plastic products and truck and rail transportation. Table 1 is a summary of each category on a year over one-, two- and three-year basis. The gain/loss pattern is shown by the color codes; we interpret rising prices as positive. Our reports in 2017 on a year/1-year basis have been much more positive than in any of our reports in the previous two years. Our analysis of the PPI data shows that commodity prices rose by 5.1 percent in 12 months through November, an improvement from the 2.5 percent decline in 36 months. The decline in the U.S. dollar this year has put upward pressure on those global commodities that are denominated in U.S. dollars.
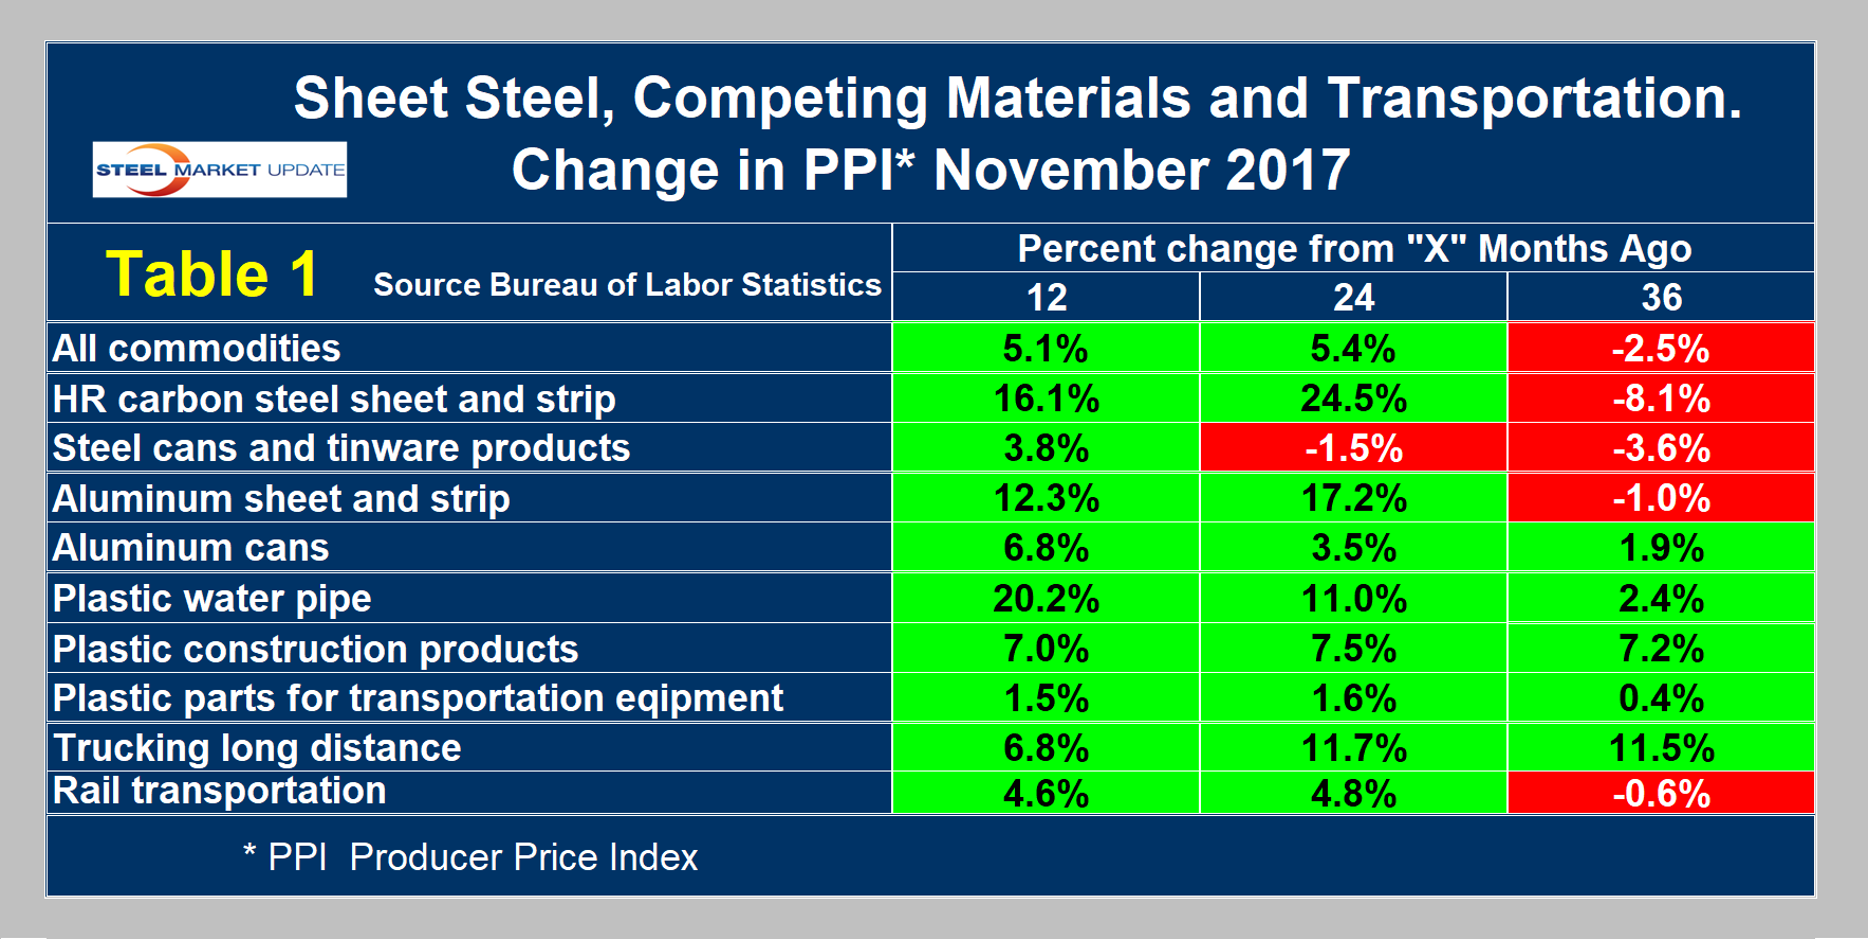
In our August report, we noted that the PPI of aluminum sheet and strip rose more than carbon steel sheet in the previous 12 months. This situation changed in November as steel played catch-up. Over the 36-month time frame, the PPI of steel declined by more than aluminum, but in both 12 and 24 months increased by more than aluminum. The changes in the PPI of steel and aluminum products as represented by cans in this report have been much less volatile than their base raw materials, namely steel and aluminum sheet.
One of the items normally reported by the BLS is OCTG, but they have released no data for this commodity since February. Data for plastic pipe is current. We understand that steel dominates in most oil production and refining applications as plastic is used more often in distribution, mostly of natural gas, to end users. The PPI of plastic piping increased dramatically in the last year. An analyst at Cleveland-based Freedom Group, Inc., told AMM that plastic made significant inroads in oil and gas pipe applications in 2009 through 2012, but since then inroads have slowed. The PPIs of plastic construction products and plastic parts for transportation equipment have been much more subdued than for steel in general because of the stagnation in hydrocarbon feedstock prices.
Table 1 also shows price changes for truck and rail transportation and indicates that rail gained competitive advantage in all three timeframes.
The official description of this program from the BLS reads as follows: “The Producer Price Index (PPI) is a family of indexes that measure the average change over time in the prices received by domestic producers of goods and services. PPIs measure price change from the perspective of the seller. This contrasts with other measures, such as the Consumer Price Index (CPI). CPIs measure price change from the purchaser’s perspective. Sellers’ and purchasers’ prices can differ due to government subsidies, sales and excise taxes, and distribution costs. More than 10,000 PPIs for individual products and groups of products are released each month. PPIs are available for the products of virtually every industry in the mining and manufacturing sectors of the U.S. economy. New PPIs are gradually being introduced for the products of industries in the construction, trade, finance and services sectors of the economy. More than 100,000 price quotations per month are organized into three sets of PPIs: (1) stage-of-processing indexes, (2) commodity indexes, and (3) indexes for the net output of industries and their products. The stage-of-processing structure organizes products by class of buyer and degree of fabrication. The commodity structure organizes products by similarity of end use or material composition. The entire output of various industries is sampled to derive price indexes for the net output of industries and their products.”


