

Market Data

September 20, 2017
SMU Currency Analysis: Dollar’s in Freefall
Written by Peter Wright
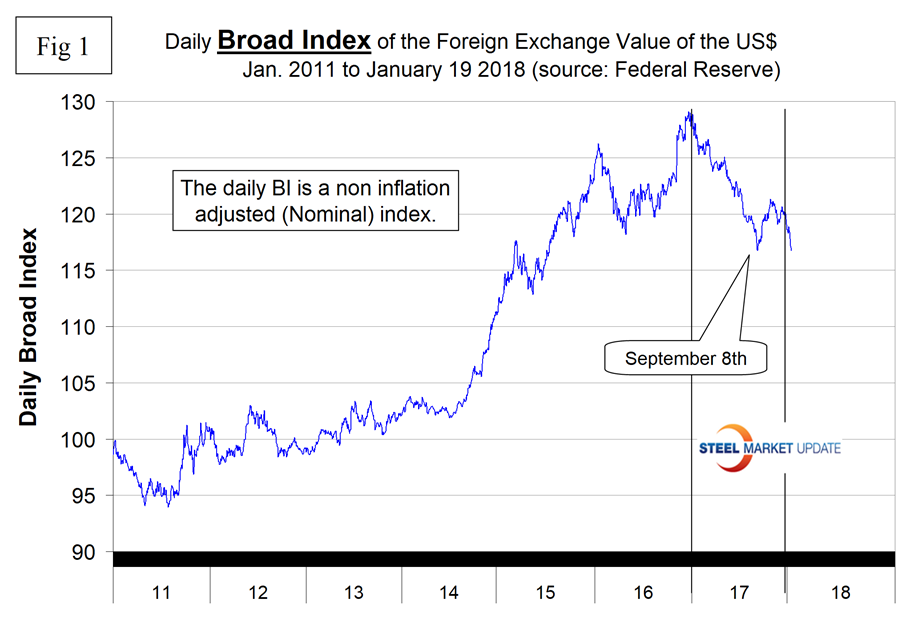
The value of the U.S. dollar on the international exchange markets has been in freefall since Dec. 12, according to Steel Market Update’s latest analysis of currencies. From Jan. 3 through Sept. 8, 2017, the Broad Index value of the U.S. dollar depreciated by 9.3 percent. The value rebounded by 2.97 percent from Sept. 9 through Dec. 12, but has since fallen back to the Sept. 9 low.
Please see the end of this report for an explanation of data sources. The analysis of currency trends is a highly technical undertaking. Therefore, in this monthly SMU update, we incorporate the opinions of analysts whom we deem credible to add color to our own data analysis.
On Jan. 23, Bespoke Investment Group wrote: “You don’t need us to tell you that a dollar just doesn’t buy what it used to, but here’s some actual proof about just how weak the greenback has recently been. With just over a week left to go in the month, the U.S. Dollar Index is already down more than 1.7 percent on the year. That’s a pretty big decline for a currency, but if you remember last year, the U.S. Dollar Index kicked off 2017 with a decline of 2.6 percent in January, in what was its worst opening month to a year since 1987.”
Also, on Jan 23, Dan Steinbok of ValueWalk wrote: “What we are witnessing is not an overnight effort to replace the U.S. dollar with the Chinese yuan in international transactions, but a progressive shift to deploy yuan in those transactions in which the Chinese economy plays a central role. This shift is gradual, linear and accumulative. Today, global currency diversification is vital because an overconcentration of foreign assets denominated in the dollar could bring huge collateral damage. However, if investors one day lose faith in the U.S. dollar—say, due to a U.S. debt crisis, a huge Trump policy blunder, a divisive bipartisan struggle for the White House or still another military overstretch—the shift away from the U.S. dollar could turn disruptive, accelerative, and geometric.”
The Broad Index value of the U.S. dollar is reported several days in arrears by the Federal Reserve; the latest value published was for Jan. 19. Figure 1 shows the index value since January 2011. The dollar had a recent peak of 128.96 on Jan. 3, 2017, which was the highest value since July 4, 2004, almost 15 years. The recent low point was Sept. 8 at 116.74. Since then, the dollar recovered to 120.64 on Dec. 12 and declined back to 116.76 on Jan.19.
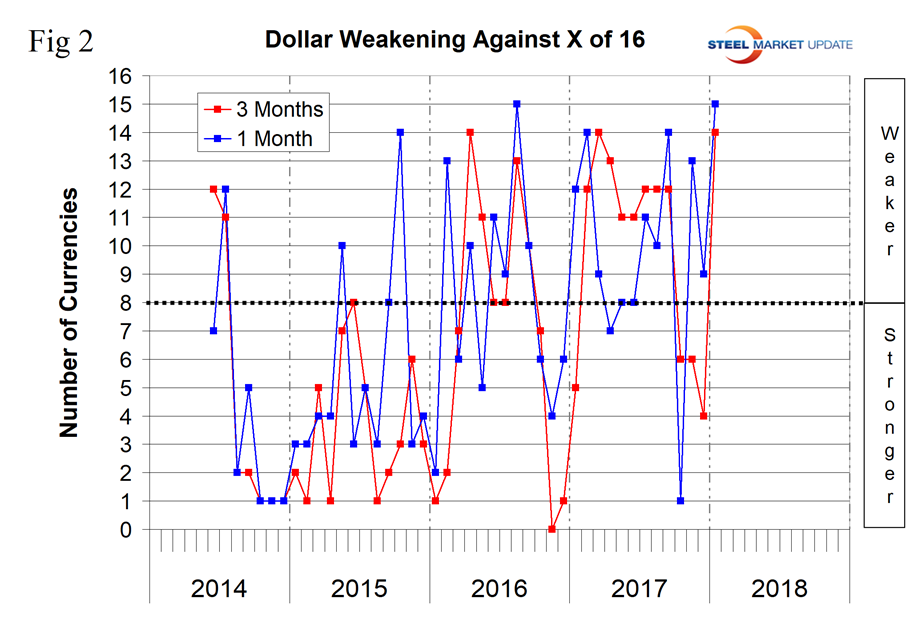
Each month, SMU publishes an update of Table 1, which shows the value of the U.S. dollar against the currencies of 16 major global steel and iron ore trading nations. The table shows the change in value in one year, three months, one month and seven days through Jan. 22. Figure 2 gives a longer-range perspective and shows the extreme gyrations that have occurred in the last three years. Figure 2 shows that the dollar weakened against 15 of the 16 in the last month and against 14 of the 16 in the last three months. Quite often the change in value of these 16 currencies does not accord with the broad index, but this is not one of those times.
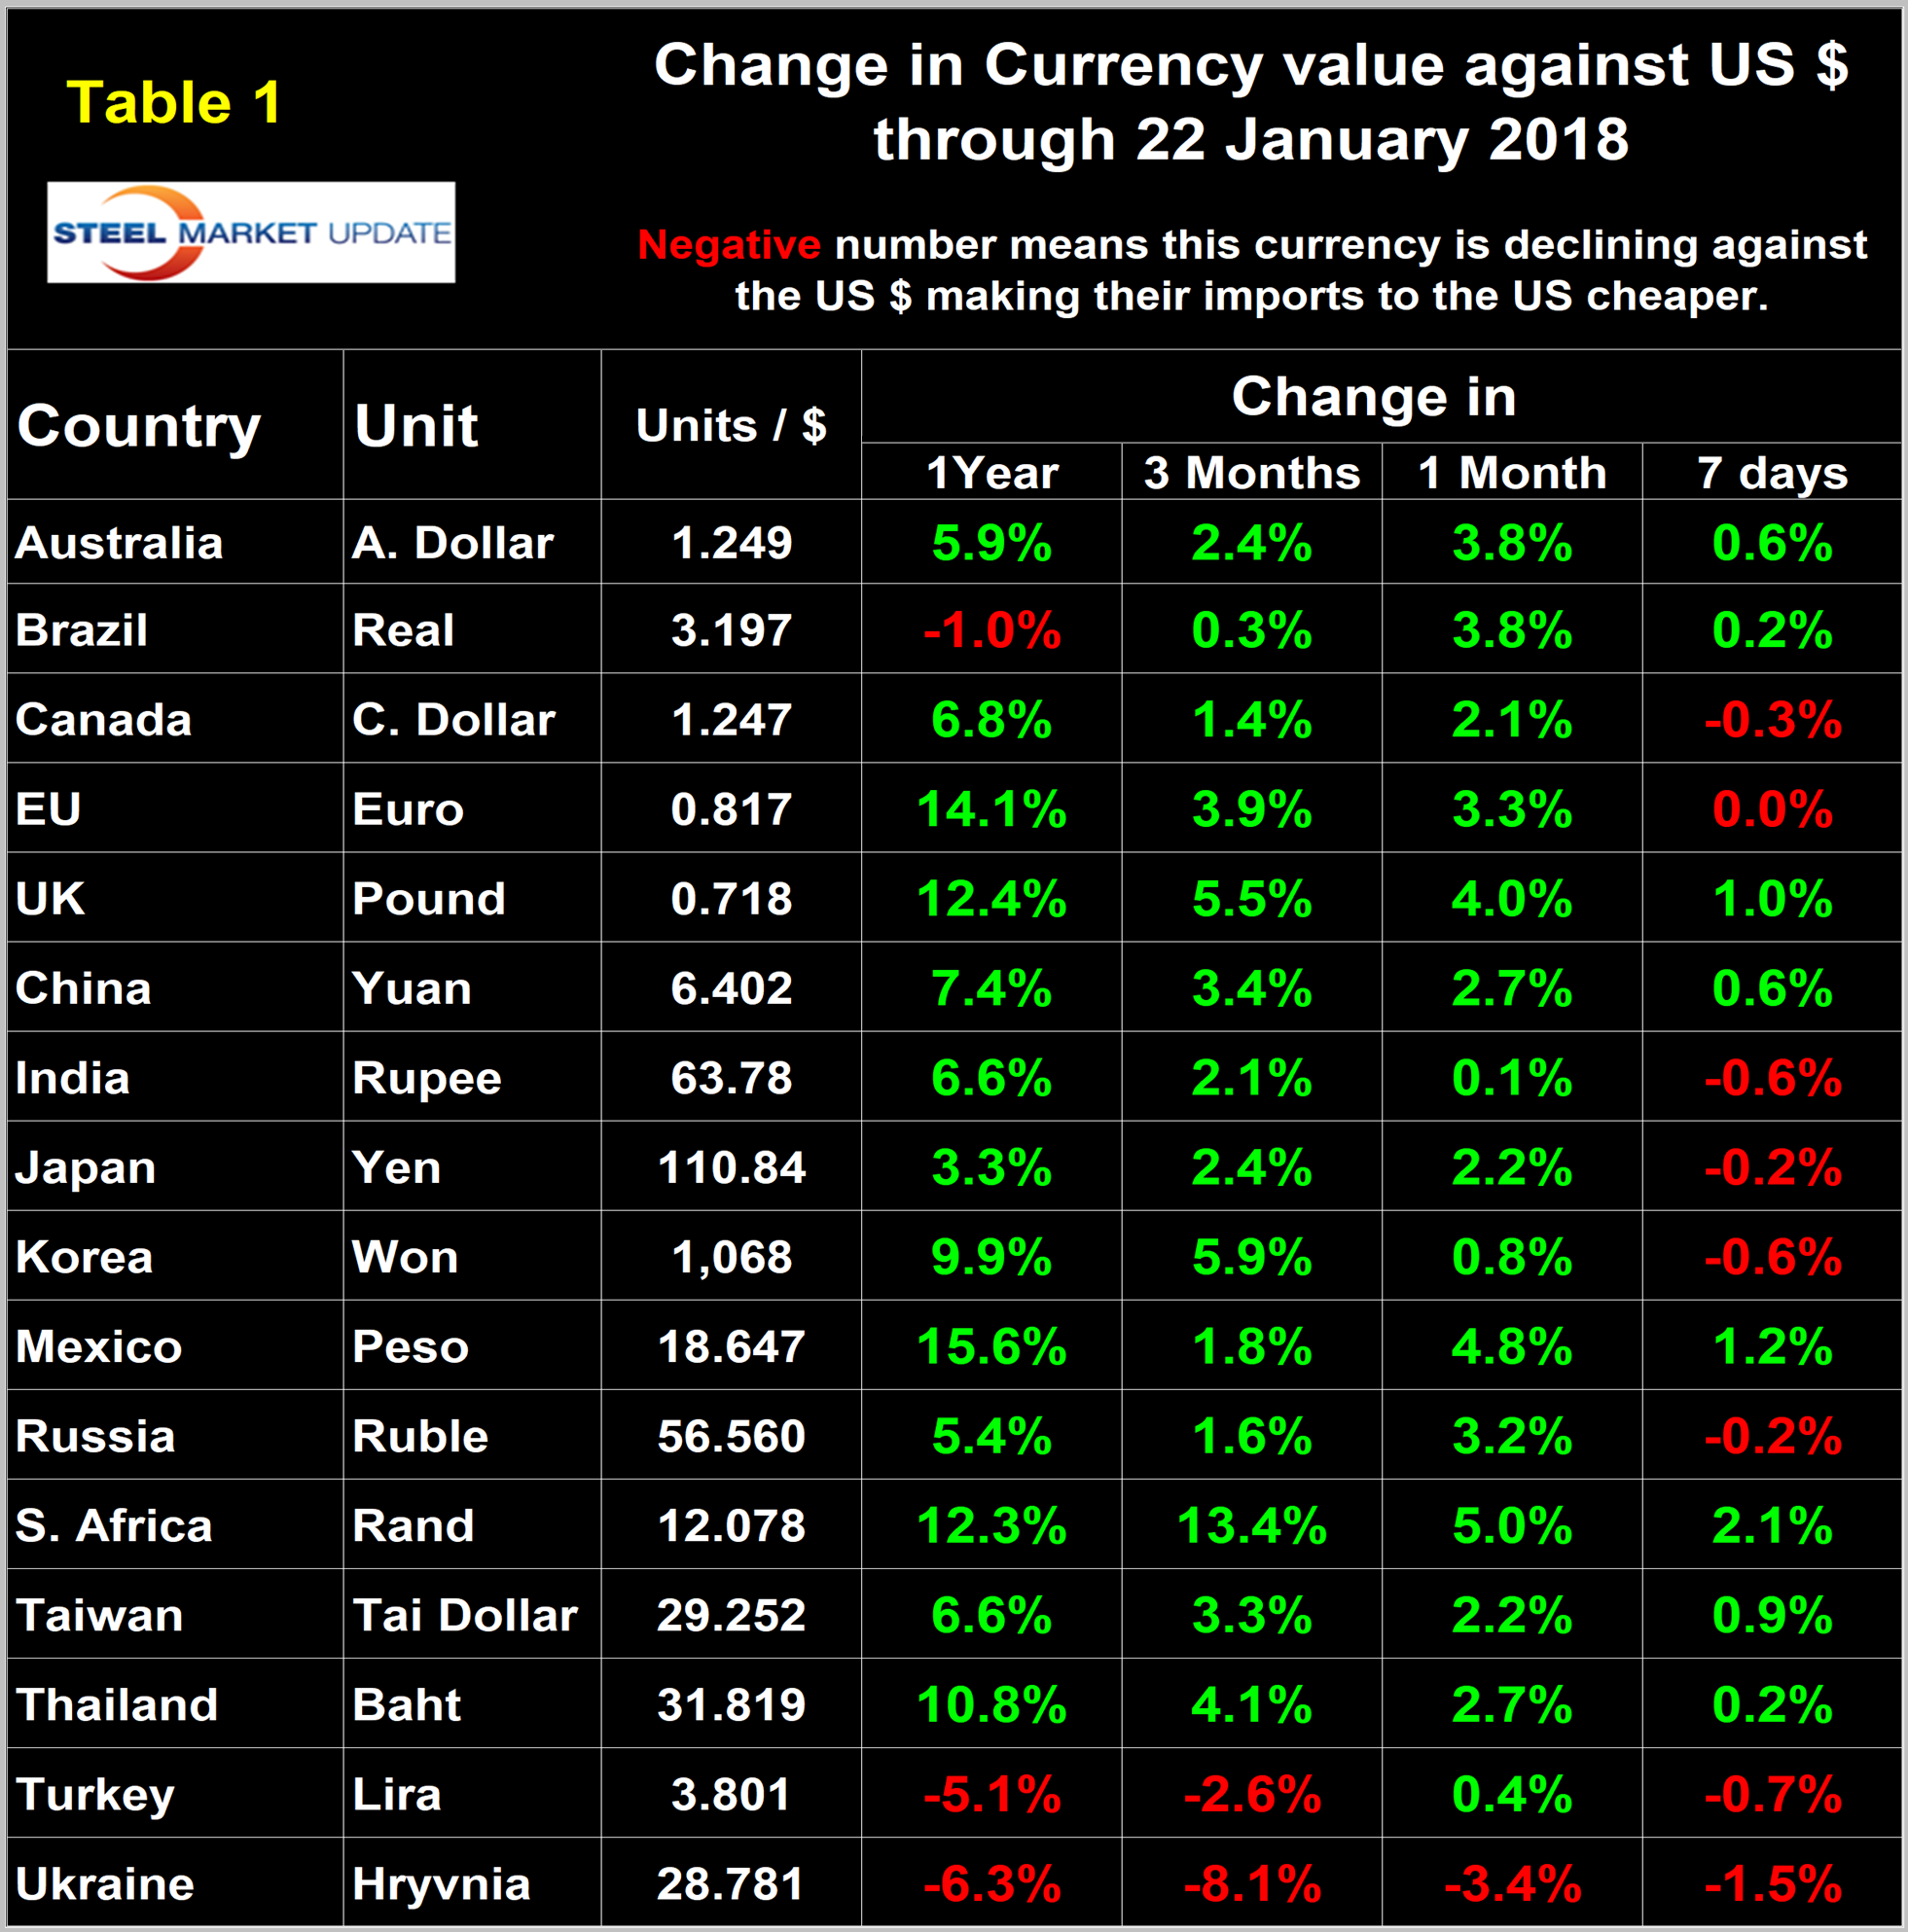
A falling dollar puts upward pressure on all commodity prices that are greenback denominated. Table 1 is color coded to indicate strengthening of the dollar in red and weakening in green. We regard strengthening of the U.S. dollar as negative and weakening as positive because of the effect on the trade balance of all commodities and on the total national trade deficit.
In each of these reports, we comment on several of the 16 steel and iron ore trading currencies listed in Table 1 and over a period of several months will describe the history of all of them. Charts for each of the 16 currencies are available through Dec. 18 for any premium subscriber who requests them.
The Chinese Yuan
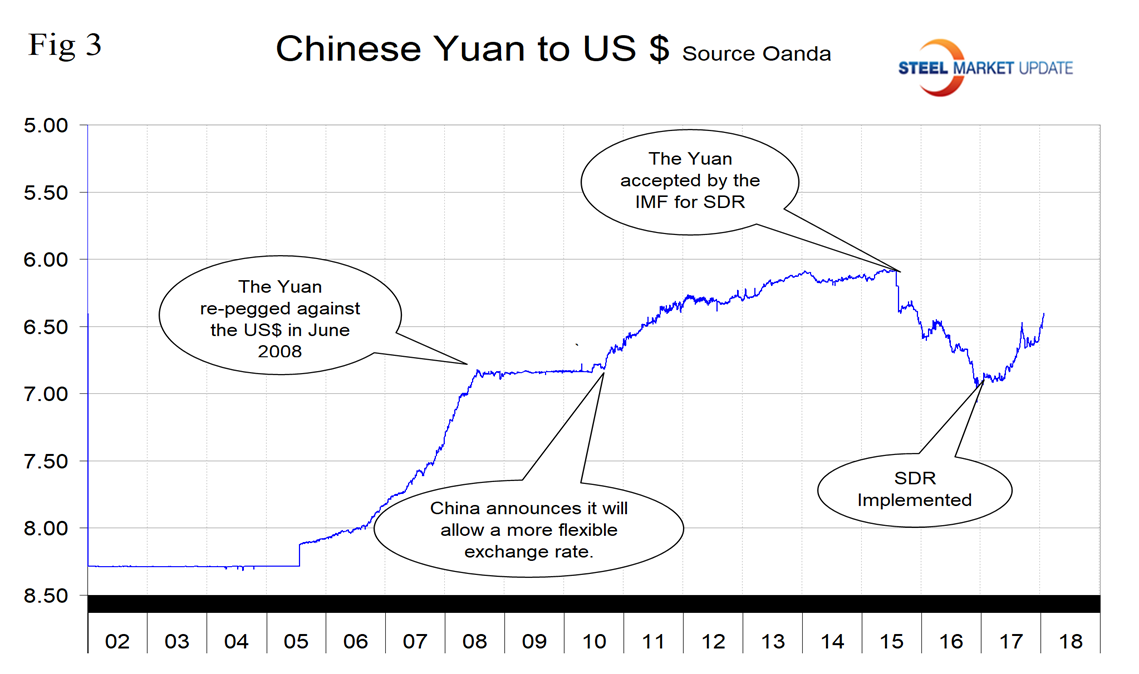
China’s yuan has strengthened against the U.S. dollar by 3.4 percent in three months and by 2.7 percent in one month (Figure 3). The yuan is now stronger than at any time since December 2015. According to the People’s Bank of China, China’s foreign exchange reserves, the largest such pile of foreign currency denominated securities in the world, rose by $21 billion in December to finish the year at $3.14 trillion. On Jan. 10, citing unnamed “people familiar with the matter,” Bloomberg reported that China was considering reducing its investment in U.S. treasuries. On Jan.14, J.G. Collins of the Stuyvesant Square Consultancy wrote: “In our view, China is probably playing hardball with the Trump administration’s trade and foreign policy. China doesn’t want to lose its status as the ‘factory nation’ of the American market because it has to employ its own population. But it wants to constrain American actions on the Korean peninsula to diplomacy and not armed intervention. China has long advocated a replacement of the U.S. dollar with a basket of currencies comprised of euros, yuan, yen and dollars as a new global reserve currency. It serves China’s interests to limit the power of the United States, particularly in Asia, and to periodically give American markets a hint of the economic power it holds over U.S. policymakers.”
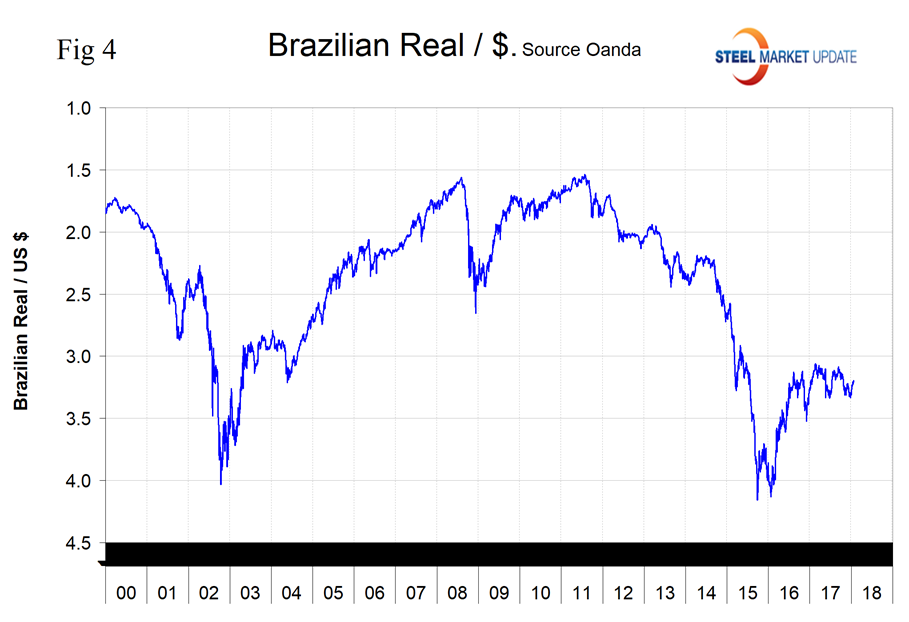
The Brazilian Real
Brazil’s real has been treading water for two and a half years and in the last three months has strengthened by 0.3 percent (Figure 4). It now takes 3.197 real to buy one dollar. In 2017, the U.S. imported 37.4 million metric tons of steel products and semis. Brazil was the second highest volume source, supplying 4.7 million metric tons or 13.5 percent.
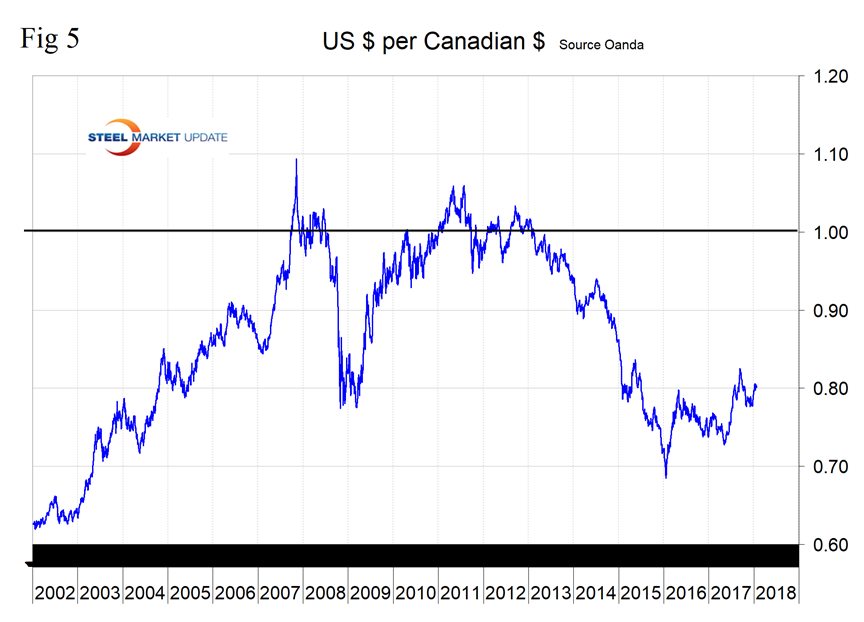
The Canadian Dollar
Canada was the highest volume source of U.S. imports in 2017 with a total of 5.6 million metric tons or 16.2 percent. In the last three months, the Canadian dollar has strengthened by 1.4 percent and on Jan. 22 was worth 80.2 U.S. cents (Figure 5). On Jan. 21, currency analyst Mark Chandler wrote: “The most common element in the narrative of dollar bears appears to be the shift in monetary policy elsewhere. Last week’s hike was the third in three quarters by the Bank of Canada. However, since the middle of last year, the Canadian dollar’s performance has not been particularly strong. Its 3.8 percent appreciation against the U.S. dollar puts in near the bottom among the major currencies. Only the yen, Swiss franc and New Zealand dollar did worse, and the latter two have depreciated. Last week, the Canadian dollar gained 0.6 percent against the U.S. dollar, the least among the major currencies.
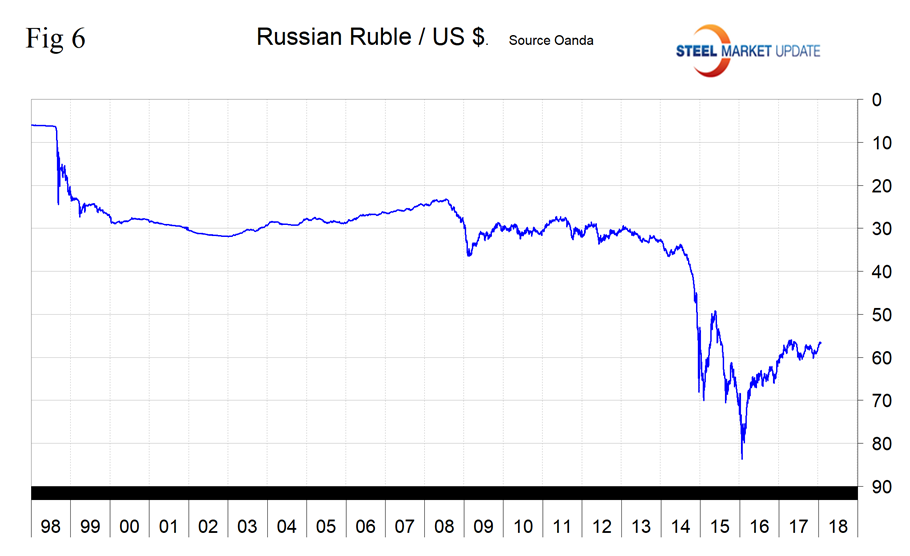
The Russian Ruble
Russia’s ruble strengthened by 1.6 percent against the dollar in the last three months and it now takes 56.56 rubles to buy one dollar (Figure 6). Russia was the fifth highest volume importer of steel products to the U.S. in 2017 with a total of 2.85 million metric tons or 8.2 percent of the total.
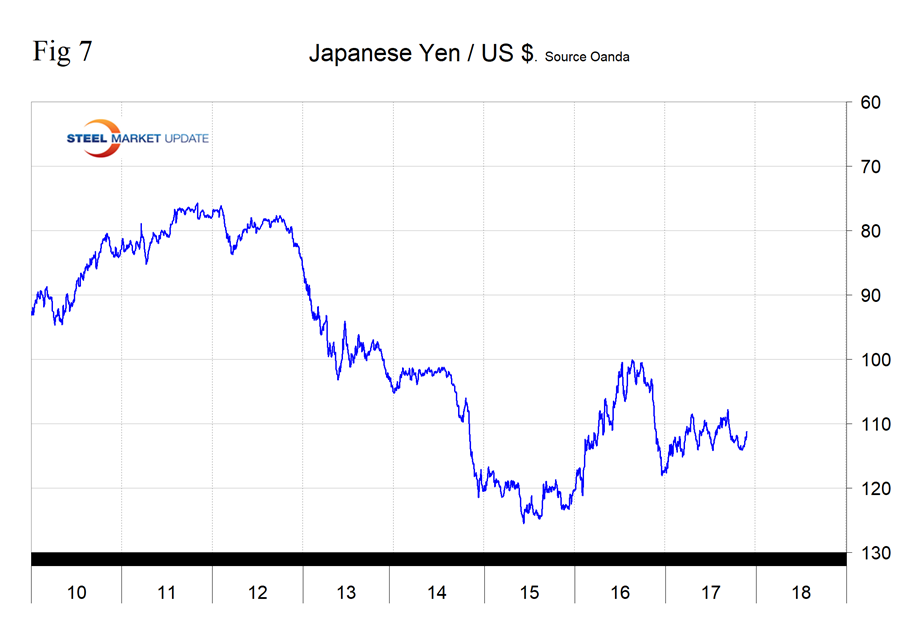
The Japanese Yen
Japan’s yen has appreciated by 2.4 percent in the last three months and one dollar is now worth 110.8 yen (Figure 7). Japan shipped 1.8 million metric tons of steel products to the U.S. in 2017, which was 5.1 percent of the total. On Jan. 23, Wall Street Breakfast had this to say: “Keeping monetary settings unchanged overnight, Japan’s central bank said it would maintain its massive stimulus program, lagging behind global peers in normalizing policy. The BOJ also announced that ‘inflation expectations have moved sideways recently,’ versus a previous assessment that they were weakening, though risks to prices remain ‘skewed to the downside.’”
Explanation of Data Sources: The broad index is published by the Federal Reserve on both a daily and monthly basis. It is a weighted average of the foreign exchange values of the U.S. dollar against the currencies of a large group of major U.S. trading partners. The index weights, which change over time, are derived from U.S. export shares and from U.S. and foreign import shares. The data are noon buying rates in New York for cable transfers payable in the listed currencies. At SMU, we use the historical exchange rates published in the Oanda Forex trading platform to track the currency value of the U.S. dollar against that of 16 steel and iron ore trading nations. Oanda operates within the guidelines of six major regulatory authorities around the world and provides access to over 70 currency pairs. Approximately $4 trillion U.S. dollars are traded every day on foreign exchange markets.


