

Market Data

September 28, 2017
Rig Count on the Increase, Good News for OCTG
Written by Peter Wright
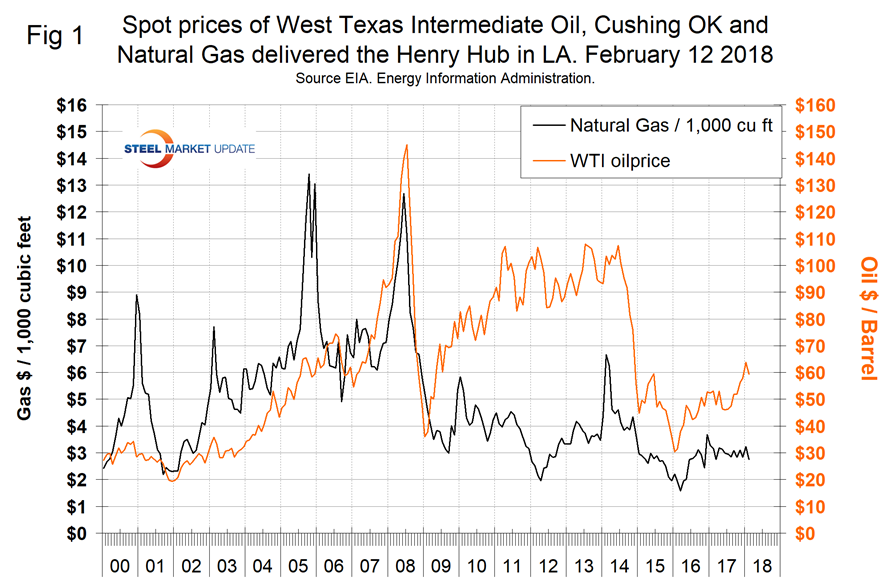
The oil and gas drill rig count is increasing rapidly as the price of West Texas Intermediate hovers near $60 per barrel. The spot price of WTI broke through the $60 level on Dec. 29 for the first time since Dec. 18, 2014. It reached $64.22 on Jan. 12 before falling back to $59.41 on Feb. 12. The total number of operating rigs exploring for oil and gas increased by 29 in the week ending Feb. 9, the largest weekly increase since Jan. 20, 2017. The prices of oil and natural gas drive the consumption of energy-related steel products including oil country tubular goods, pipe fittings and well head equipment, among others. About 5.5 million tons of hot rolled sheet was used to make welded tubular goods in 2017 (not including OCTG).
On Feb. 12, the Energy Information Administration (EIA) published a sensitivity analysis for energy exports under different price and technology assumptions and concluded as follows: “EIA projects that the United States will become a net energy exporter in 2022 in the newly released Annual Energy Outlook 2018 Reference case, primarily driven by changes in petroleum and natural gas markets. The transition from net energy importer to net energy exporter occurs even earlier in some sensitivity cases that modify assumptions about oil prices or resource extraction. Sensitivity cases with less energy production project that the United States will remain a net energy importer through 2050. The transition of the United States to a net energy exporter is fastest in the High Oil Price case, where higher crude oil prices lead to more oil and natural gas production and transition the United States into a net exporter by 2020. In that case, higher crude oil prices also result in higher petroleum product prices and lower consumption of petroleum products, driving decreases in net petroleum imports. In the High Oil and Gas Resource and Technology case, with more favorable assumptions for geology and technological developments, the United States becomes a net exporter in 2020, and net exports increase through the end of the projection period. In cases with relatively low oil prices or less favorable assumptions for geology and technological developments, U.S. net energy trade still decreases, but the United States remains a net energy importer through 2050.”
Figure 1 shows historical oil and gas prices through Feb. 12 since January 2000, with the spot price for WTI falling below $60 per barrel for the first time since Dec. 28. EIA reports that the price of natural gas at the Henry Hub in Louisiana reached $4.16/1,000 cubic feet on Jan. 5 before falling back to $2.75 on Feb. 9. Jan. 5 was the first time for gas to break through $4.00 since Nov. 2014. EIA expects the share of U.S. utility-scale electricity generation from natural gas to average about 32 percent in 2018, down from 34 percent in 2016. EIA projects the 2018 share of generation from coal will average 30 percent, about the same as last year. Generation from renewable energy sources other than hydropower will grow from about 8 percent in 2016 to a forecast share of nearly 10 percent in 2018.
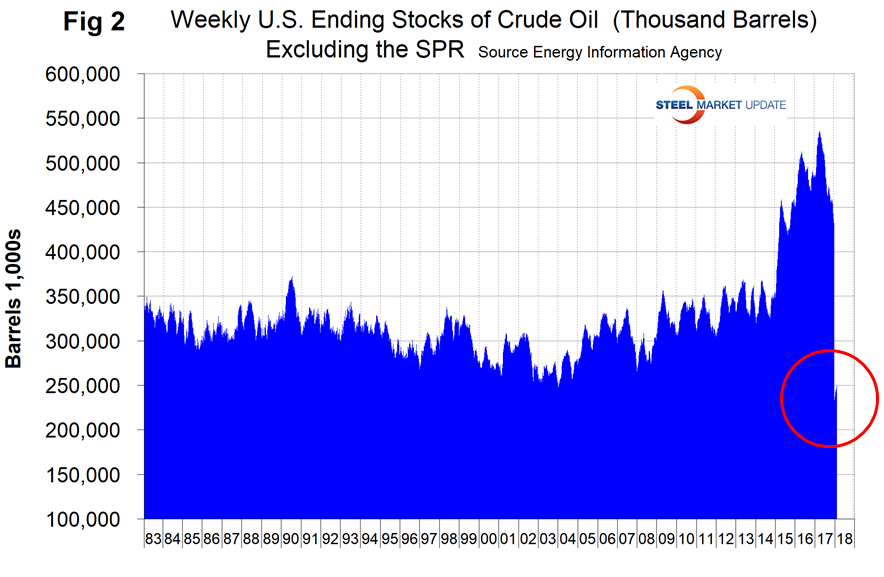
Since March 24, U.S. stocks of crude oil, excluding the strategic petroleum reserve, have been in free fall from 534 million to 249 million barrels on Feb. 9, a reduction of 53.4 percent. On a year-over-year basis, stocks have declined for 30 straight weeks with a very heavy decline at the end of 2017 (Figure 2).
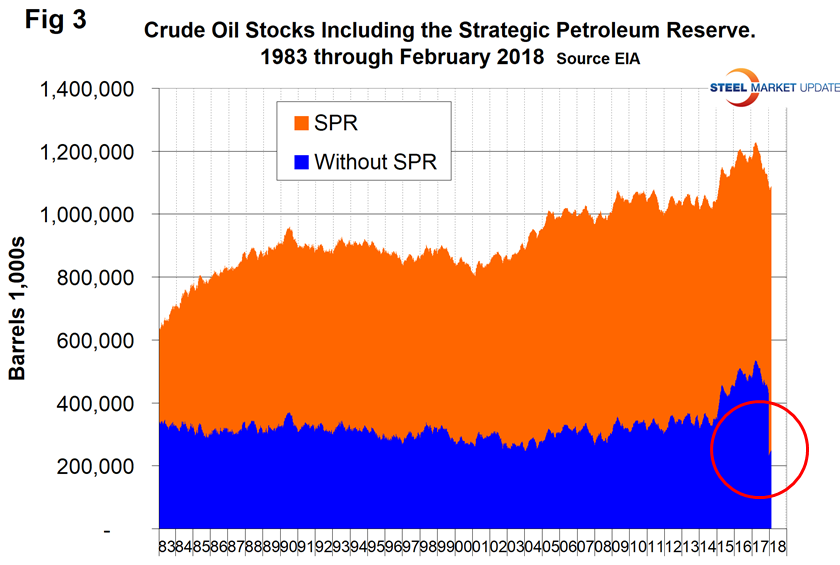
We were so surprised by this that we decided to dig deeper. What we found was that in the last week of 2017, 192 million barrels were transferred to the strategic petroleum reserve from the available inventory. We have seen no commentary on this anywhere in the press, but what we are reporting here is the official picture (Figure 3).
The total number of operating rigs in the U.S. on Feb. 16 was 975, up from 939 in our last update on Jan.12 and the highest since April 10, 2015. Figure 4 shows the total number of operating rigs in the U.S. and the weekly change.
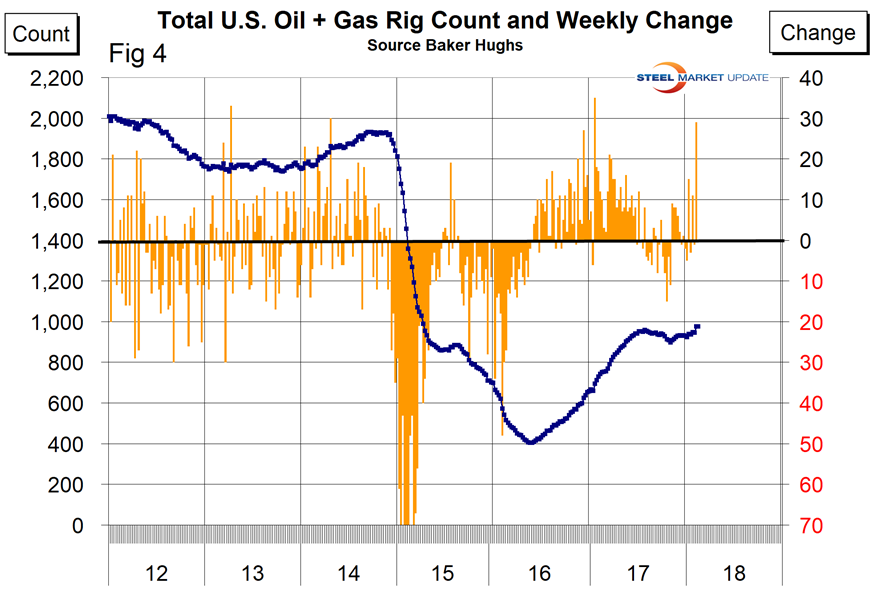
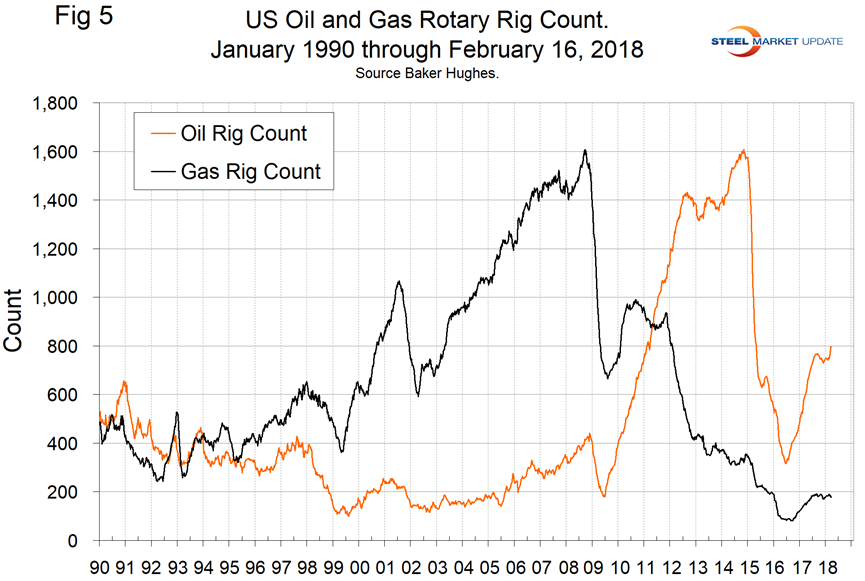
In the week ending Feb. 9, the total on-shore count increased by 29 with zero increase in the week ending Feb 16. The oil rig count had a low point of 316 on June 27, 2016, and stood at 798 on Feb. 16. The U.S. gas rig count rose from its low point of 81 on Aug. 5, 2016, to 177 on Feb. 16. The year-over-year growth rate of U.S. total rigs was 29.8 percent in the latest data. Figure 5 shows the Baker Hughes U.S. Rotary Rig Counts for oil and gas equipment in the U.S. (explanation below).
On a regional basis in the U.S., the big three states for operating rigs are Texas, Oklahoma and North Dakota. Figure 6 shows the land rig count in those states since 2000 and that non-conventional drilling in North Dakota has declined by 73 percent from its heyday in late 2014. This is not as bad as it sounds because previously drilled and capped wells are being put back on stream.
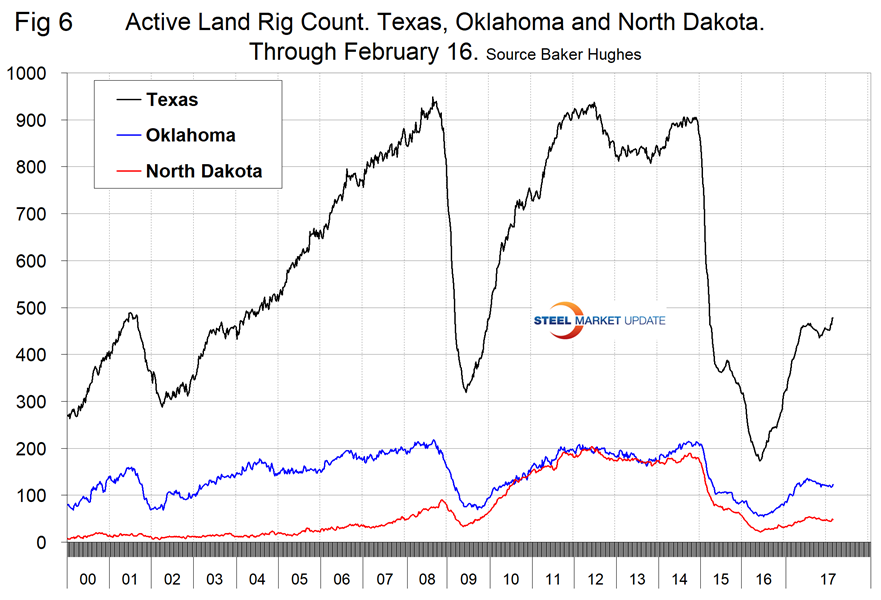
Figure 7 illustrates the monthly U.S. oilfield production of crude from January 1970 through November 2017 (latest data available). The all-time high was 310 million barrels in November 1970. In November 2017, production was 301 million barrels, the first time over 300 million barrels since March 1971. The record looks set to fall in 2018. On Feb. 5, the New York Times reported that Exxon Mobil will triple its oil and gas production in the Permian Basin, which is the nation’s hottest shale field. The Permian is the size of South Dakota and straddles the Texas- New Mexico border. It comprises multiple thick shale layers, which reduces the cost of exploration, drilling and operation.
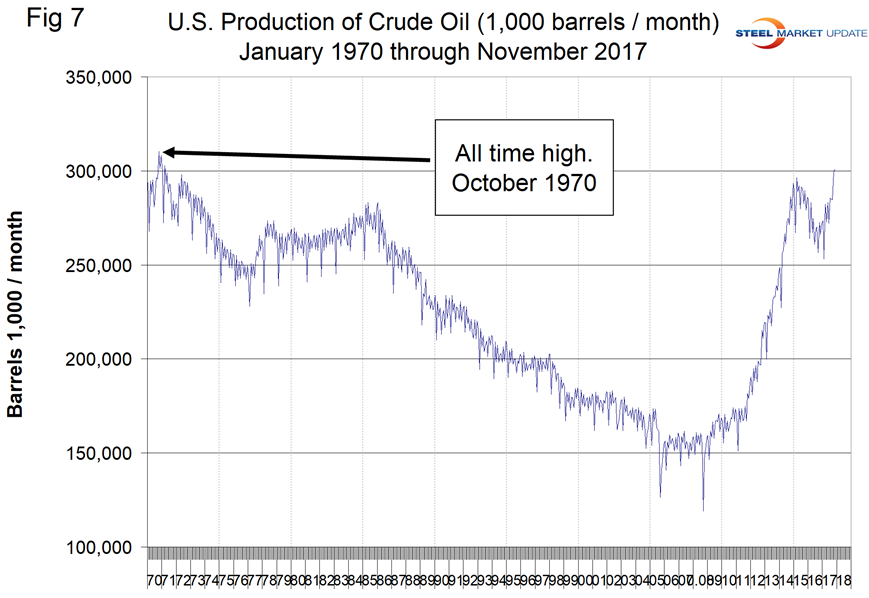
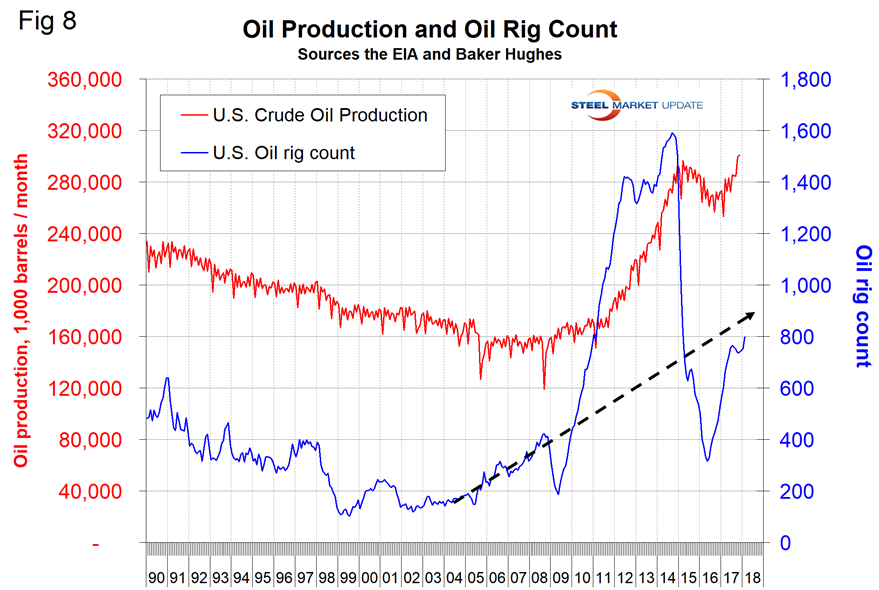
Figure 8 compares oil production and the oil rig count and shows how the increase in exploratory wells drove production from 2009 through late 2014 when the oil price collapsed. The subsequent decline in production was much less marked and is again increasing. Our take on this is that the huge increase in exploratory oil rigs beginning in 2009 may have been an anomaly and that we won’t see a repeat of the number operating in 2014 for a very long time.
Baker Hughes Rotary Rig Count: This is a weekly census of the number of drilling rigs actively exploring for or developing oil or natural gas in the United States. Rigs are considered active from the time they break ground until the time they reach their target depth and may be establishing a new well or sidetracking an existing one. The Baker Hughes Rotary Rig count includes only those rigs that are significant consumers of oilfield services and supplies.


