

Market Data

September 29, 2017
Economic Indicators Positive for Manufacturing
Written by Peter Wright
Economic indicators of manufacturing activity are still healthy overall and portend well for the balance of this year.
This report summarizes seven data sources that describe the state of manufacturing in the U.S. We have reported on most of these separately in our Steel Market Update publications, therefore will be brief in this summary. We don’t expect these data sources to all point in the same direction. Our intention in summarizing them in one document is to provide a consensus of the state of this critical steel consumption sector. Based on AISI estimates of steel mill shipments by market classification, almost 50 percent of steel consumption in the U.S. is manufacturing oriented. This breaks down to about 27 percent being consumed in ground transportation, 9 percent in machinery and equipment, 5 percent in appliances, 4 percent in defense and about 4 percent in containers.
The Industrial Production Index
Figure 1 shows the IP index since January 2007 with the year-over-year growth. The three-month moving average (3MMA) had negative growth every month from October 2015 through December 2016 as shown by the brown bars in Figure 1. There was a decrease in negativity throughout 2016. January this year was the first month of positive growth in the 3MMA since August 2015. Growth improved in each of the 10 months through July 2017 from negative 1.24 percent in September last year to positive 2.25 percent in July before falling back to 2.01 percent in August.
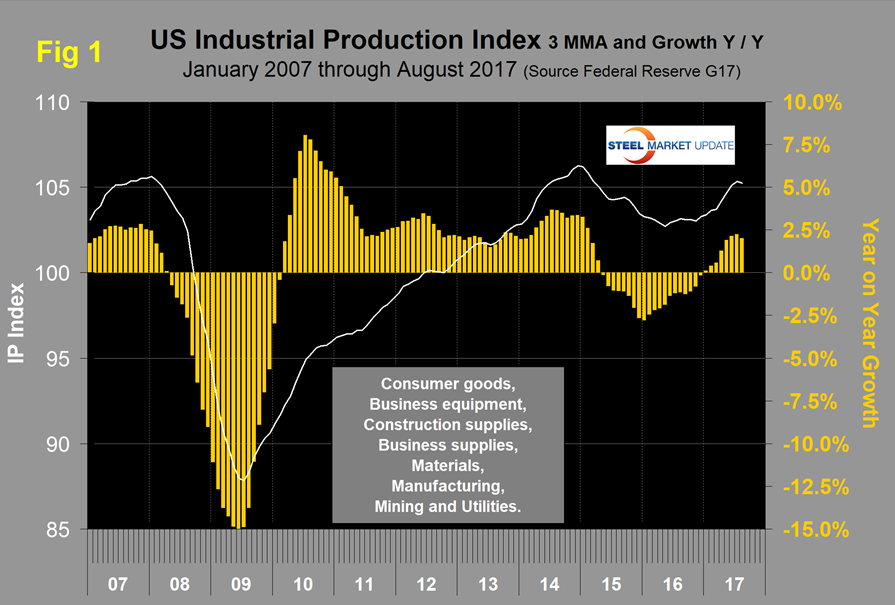
Here is the overview from the Federal Reserve: “Industrial production declined 0.9 percent in August following six consecutive monthly gains. Hurricane Harvey, which hit the Gulf Coast of Texas in late August, is estimated to have reduced the rate of change in total output by roughly 3/4 percentage point. The index for manufacturing decreased 0.3 percent; storm-related effects appear to have reduced the rate of change in factory output in August about 3/4 percentage point. The manufacturing industries with the largest estimated storm-related effects were petroleum refining, organic chemicals, and plastics materials and resins.”
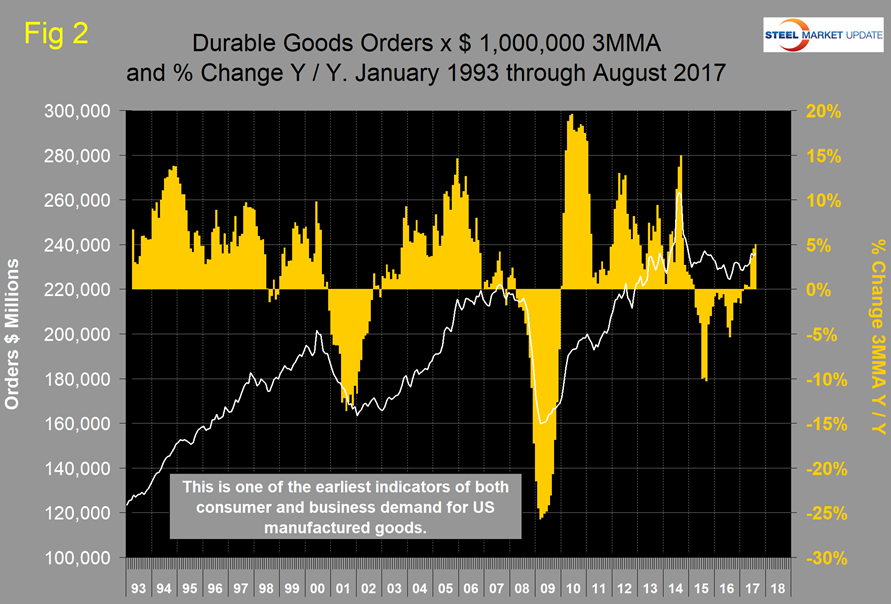
New Orders for Durable Goods
The U.S. Census Bureau announced on Wednesday that new orders for manufactured durable goods in August increased by $3.9 billion or 1.7 percent to $232.8 billion. This increase, up two of the last three months, followed a 6.8 percent July decrease. Excluding transportation, new orders increased 0.2 percent. Excluding defense, new orders increased 2.2 percent. Transportation equipment, also up two of the last three months, led the increase by $3.6 billion or 4.9 percent to $77.4 billion.
At SMU, our take on this is somewhat more positive because we think it’s necessary to look at a 3MMA year over year to get a more realistic picture.Figure 2 shows the 3MMA of monthly orders for durable goods since January 2010 with the percent change year over year. March this year was the first month since April 2015 to have positive year-over-year growth. There has been an improving trend since August 2015 with a positive surge in the most recent data for June, July and August this year.
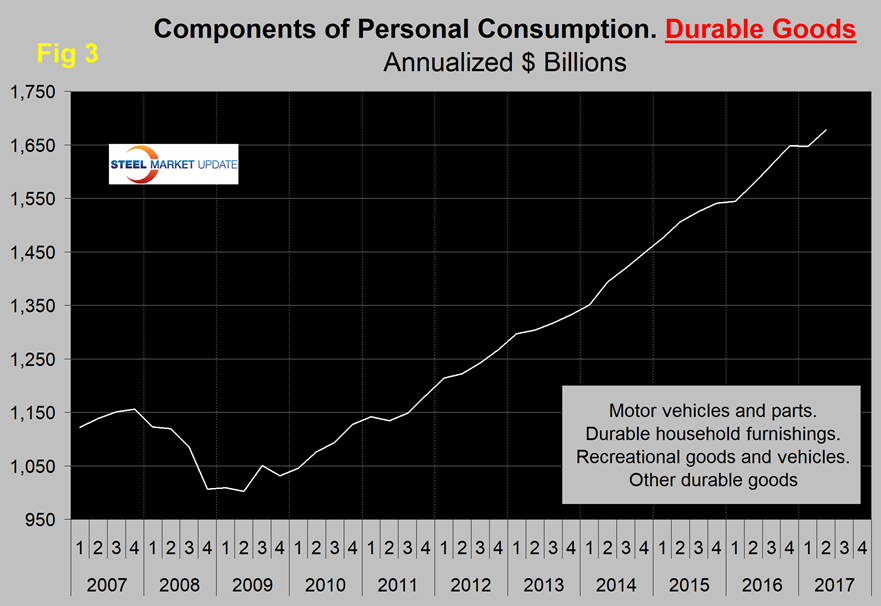
The Durable Goods Portion of GDP
The third estimate of Q2 GDP was released last Thursday and confirmed the second estimate of a 3.1 percent growth rate. A sub-component of the quarterly data is durable goods, which is part of the personal consumption calculation. It therefore contains no military hardware or civil aircraft data. This is shown in Figure 3 and presumably because of the exclusions just mentioned looks nothing like Figure 2. With the exception of one quarter, Q1 2017, the durable goods portion of GDP saw positive growth every quarter since Q2 2011.
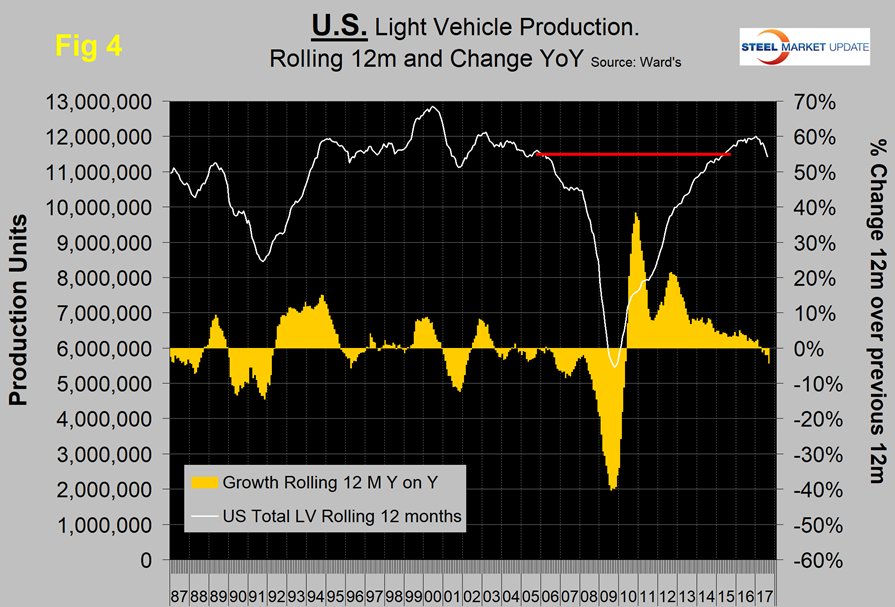
Light Vehicle Production
Light vehicle production in NAFTA declined by 8.3 percent in three months through August year over year with very negative momentum. Assemblies in the U.S. declined by 13.0 percent, Canada declined by 8.1 percent and Mexico expanded by 7.0 percent. Mexico has been taking share from the U.S. for over a year, also from Canada to a lesser extent. Figure 4shows light vehicle production in the U.S. on a rolling 12-month basis with the year-over-year growth rate. Growth has been negative in the U.S. every month in the period April through August this year. This data comes from Ward’s Automotive. There is a huge movement of components and sub-assemblies in both directions across the southern border, therefore it is not known whether the Ward’s data exaggerates or deflates the national differentials.
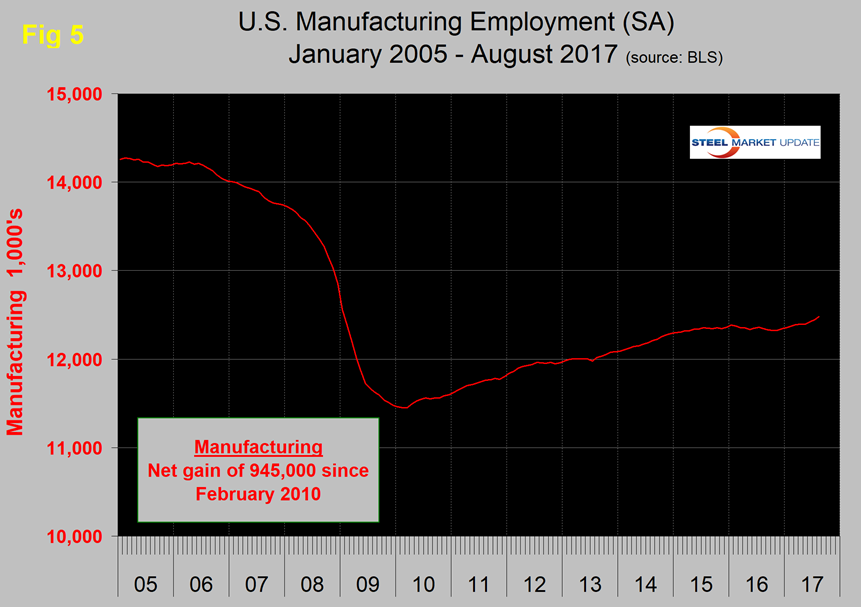
Manufacturing Employment
Manufacturing employment dived during the recession and gradually improved from the spring of 2010 through 2014. Growth was flat in 2015 and declined slightly in 2016 when 23,000 jobs were lost in the year as a whole. There was a turnaround in the first eight months through August this year when 137,000 manufacturing jobs were created (Figure 5).
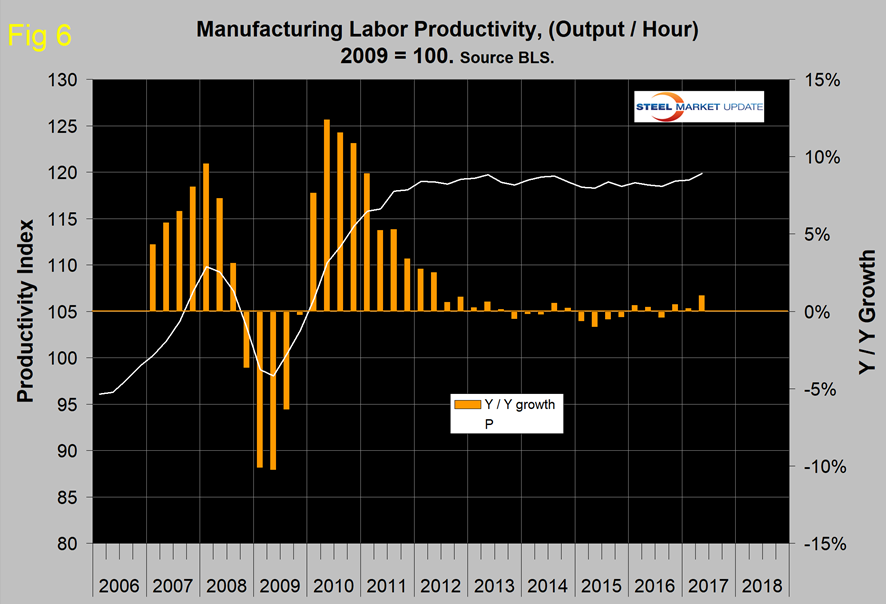
Manufacturing Productivity
The Bureau of Labor Statistics reports that in Q2 2017 manufacturing productivity improved by 1.0 percent year over year (Figure 6). This was the highest growth rate since Q4 2012. The bad news is that output per hour is still at the same level as it was in Q2 2013.
The ISM Manufacturing Index
The Institute for Supply Management’s manufacturing index is a diffusion index. As ISM states, “Diffusion indexes have the properties of leading indicators and are convenient summary measures showing the prevailing direction of change and the scope of change. An index value above 50 percent indicates that the manufacturing economy is generally expanding; below 50 percent indicates that it is generally declining.” Figure 7 shows the 3MMA of the ISM index from January 1997 through August 2017 with an improving trend since January 2016. In August, the 3MMA of the index at 57.63 was the highest since May 2011.
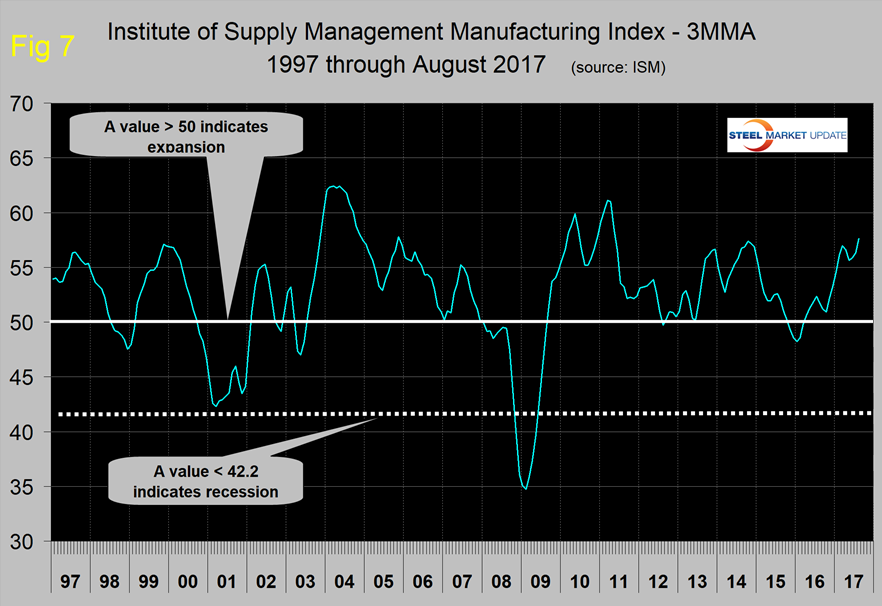
Moody’s had this to say about the August result: “Things are looking up for manufacturing. The ISM manufacturing index increased from 56.3 in July to 58.8 in August. This was better than our above- consensus forecast, and the details were solid. New orders remained above 60 for the third consecutive month, and the production index edged up from 60.6 to 61. The employment index rose more than 4 points, while the increase in inventories suggests stockpiles will add to GDP growth this quarter. The trade details were softer than in July. Overall, fundamentals for manufacturing are decent, as the global economy is improving and the U.S. dollar has depreciated some.”
SMU Comment: The ISM index, which we give the most credence, is at its strongest level since May 2011 and signaling expansion. This is the only leading indicator examined in this update. Auto assemblies and supplier industries are slowing in NAFTA, and the U.S. and Canada are losing share to Mexico. Manufacturing has added 137,000 jobs this year through August and the employment component of the ISM index has had positive growth in each of the last 11 months. The industrial production index and new orders for durable goods have positive growth. Therefore, we conclude that the balance of these seven measures are positive signs for the balance of 2017.


