Plate

October 11, 2017
Analysis of Sheet, Plate Imports by District of Entry, Source
Written by Peter Wright
This Steel Market Update analysis of sheet and plate imports by district of entry and source through August 2017 includes both coiled and cut-to-length plate for the first time. We believe that misinformation (or a lack of) about regional import volumes is often used to influence purchase decisions. Our intent with this analysis of tonnage by district of entry is to describe in detail what is going on in a company’s immediate neighborhood and thus provide a negotiating advantage for our premium subscribers.
![]() Premium members will find reports in the Imports/Exports section of our website that break down the import tonnage through August into the port of entry and country of origin in metric tons. Products analyzed in this way are hot rolled, cold rolled, hot-dipped galvanized sheet, other metallic coated sheet, cut to length plate and coiled plate. This data set is large; therefore, we make no attempt to provide a commentary. Each reader’s interest will be different and he or she simply needs to select one of the six products, then find the nearest port or ports of entry to see how much came into their region each month and from where. It is clear from these detailed reports that the change in tonnage entering a particular district in many (or most) cases is completely different to the change in volume at the national level.
Premium members will find reports in the Imports/Exports section of our website that break down the import tonnage through August into the port of entry and country of origin in metric tons. Products analyzed in this way are hot rolled, cold rolled, hot-dipped galvanized sheet, other metallic coated sheet, cut to length plate and coiled plate. This data set is large; therefore, we make no attempt to provide a commentary. Each reader’s interest will be different and he or she simply needs to select one of the six products, then find the nearest port or ports of entry to see how much came into their region each month and from where. It is clear from these detailed reports that the change in tonnage entering a particular district in many (or most) cases is completely different to the change in volume at the national level.
Some examples to illustrate why this information can be actionable are as follows. Examples are for 2017 through August:
· Total HRC imports down by 30 percent, but Houston up by 80 percent and San Francisco down by 90 percent.
· Total coiled plate imports up by 3 percent, but New Orleans down by 82 percent and Detroit up by 11 percent.
· Total CRC imports up by 46 percent, but Laredo down by 14 percent and New Orleans up by 38 percent.
The discrepancy between the change in the national total and the individual regions is why we think it’s important for both market understanding and negotiating position to know what is going on in your own backyard.
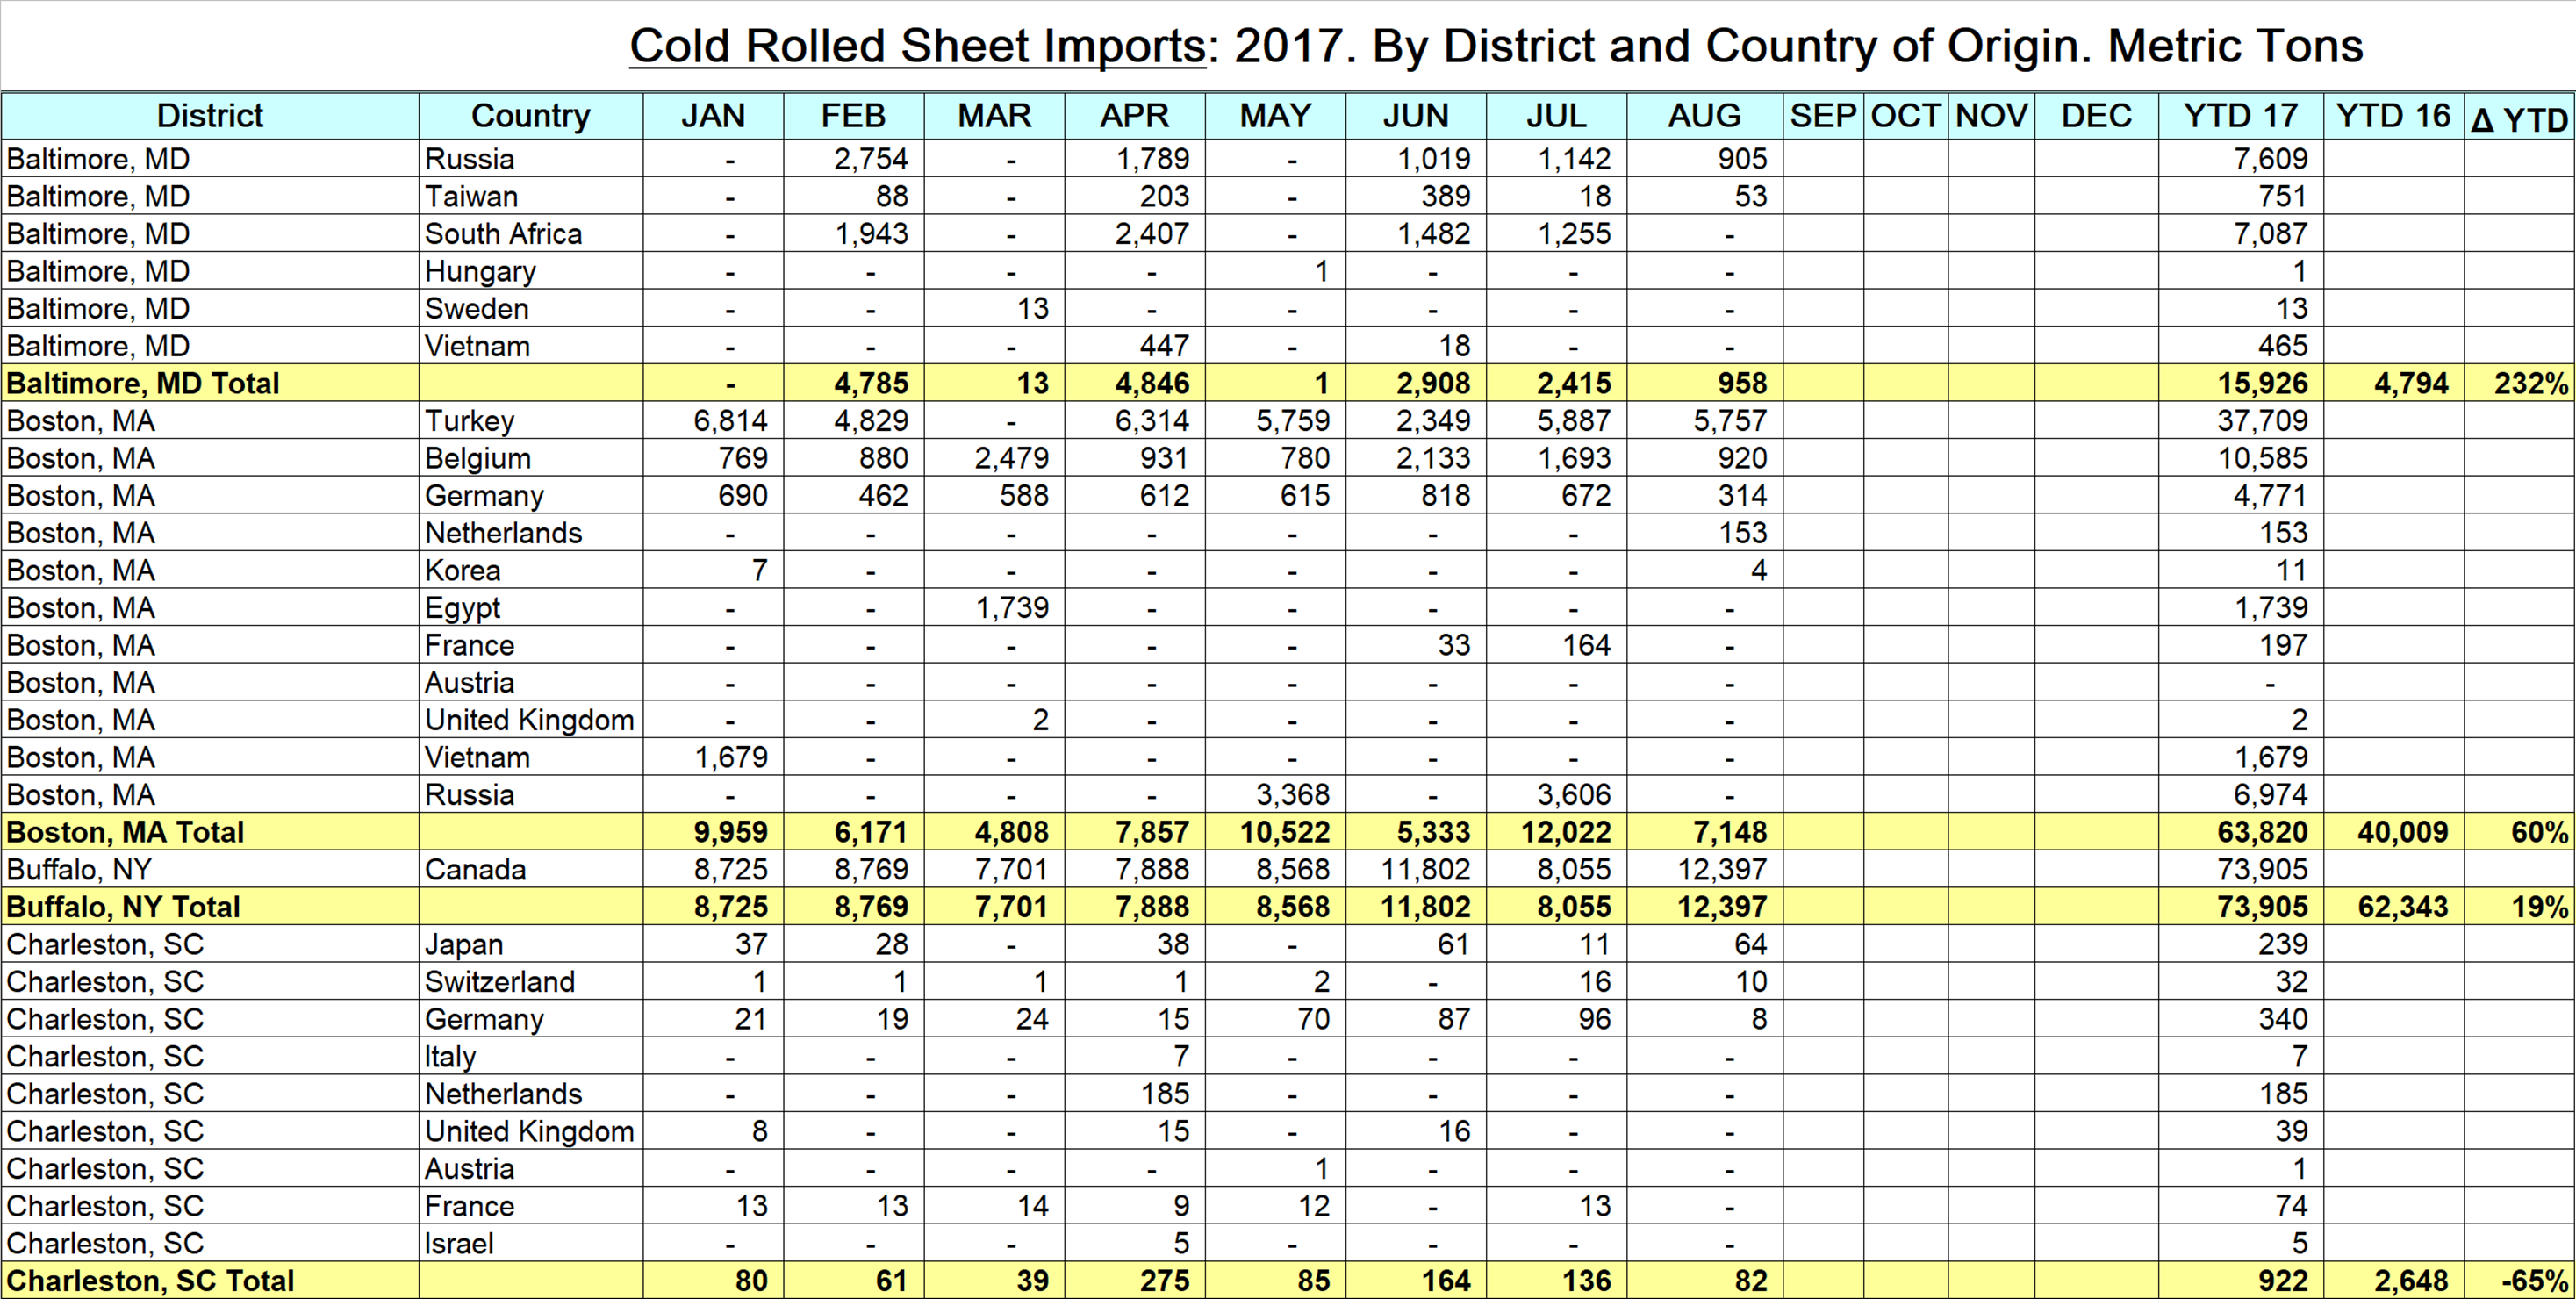
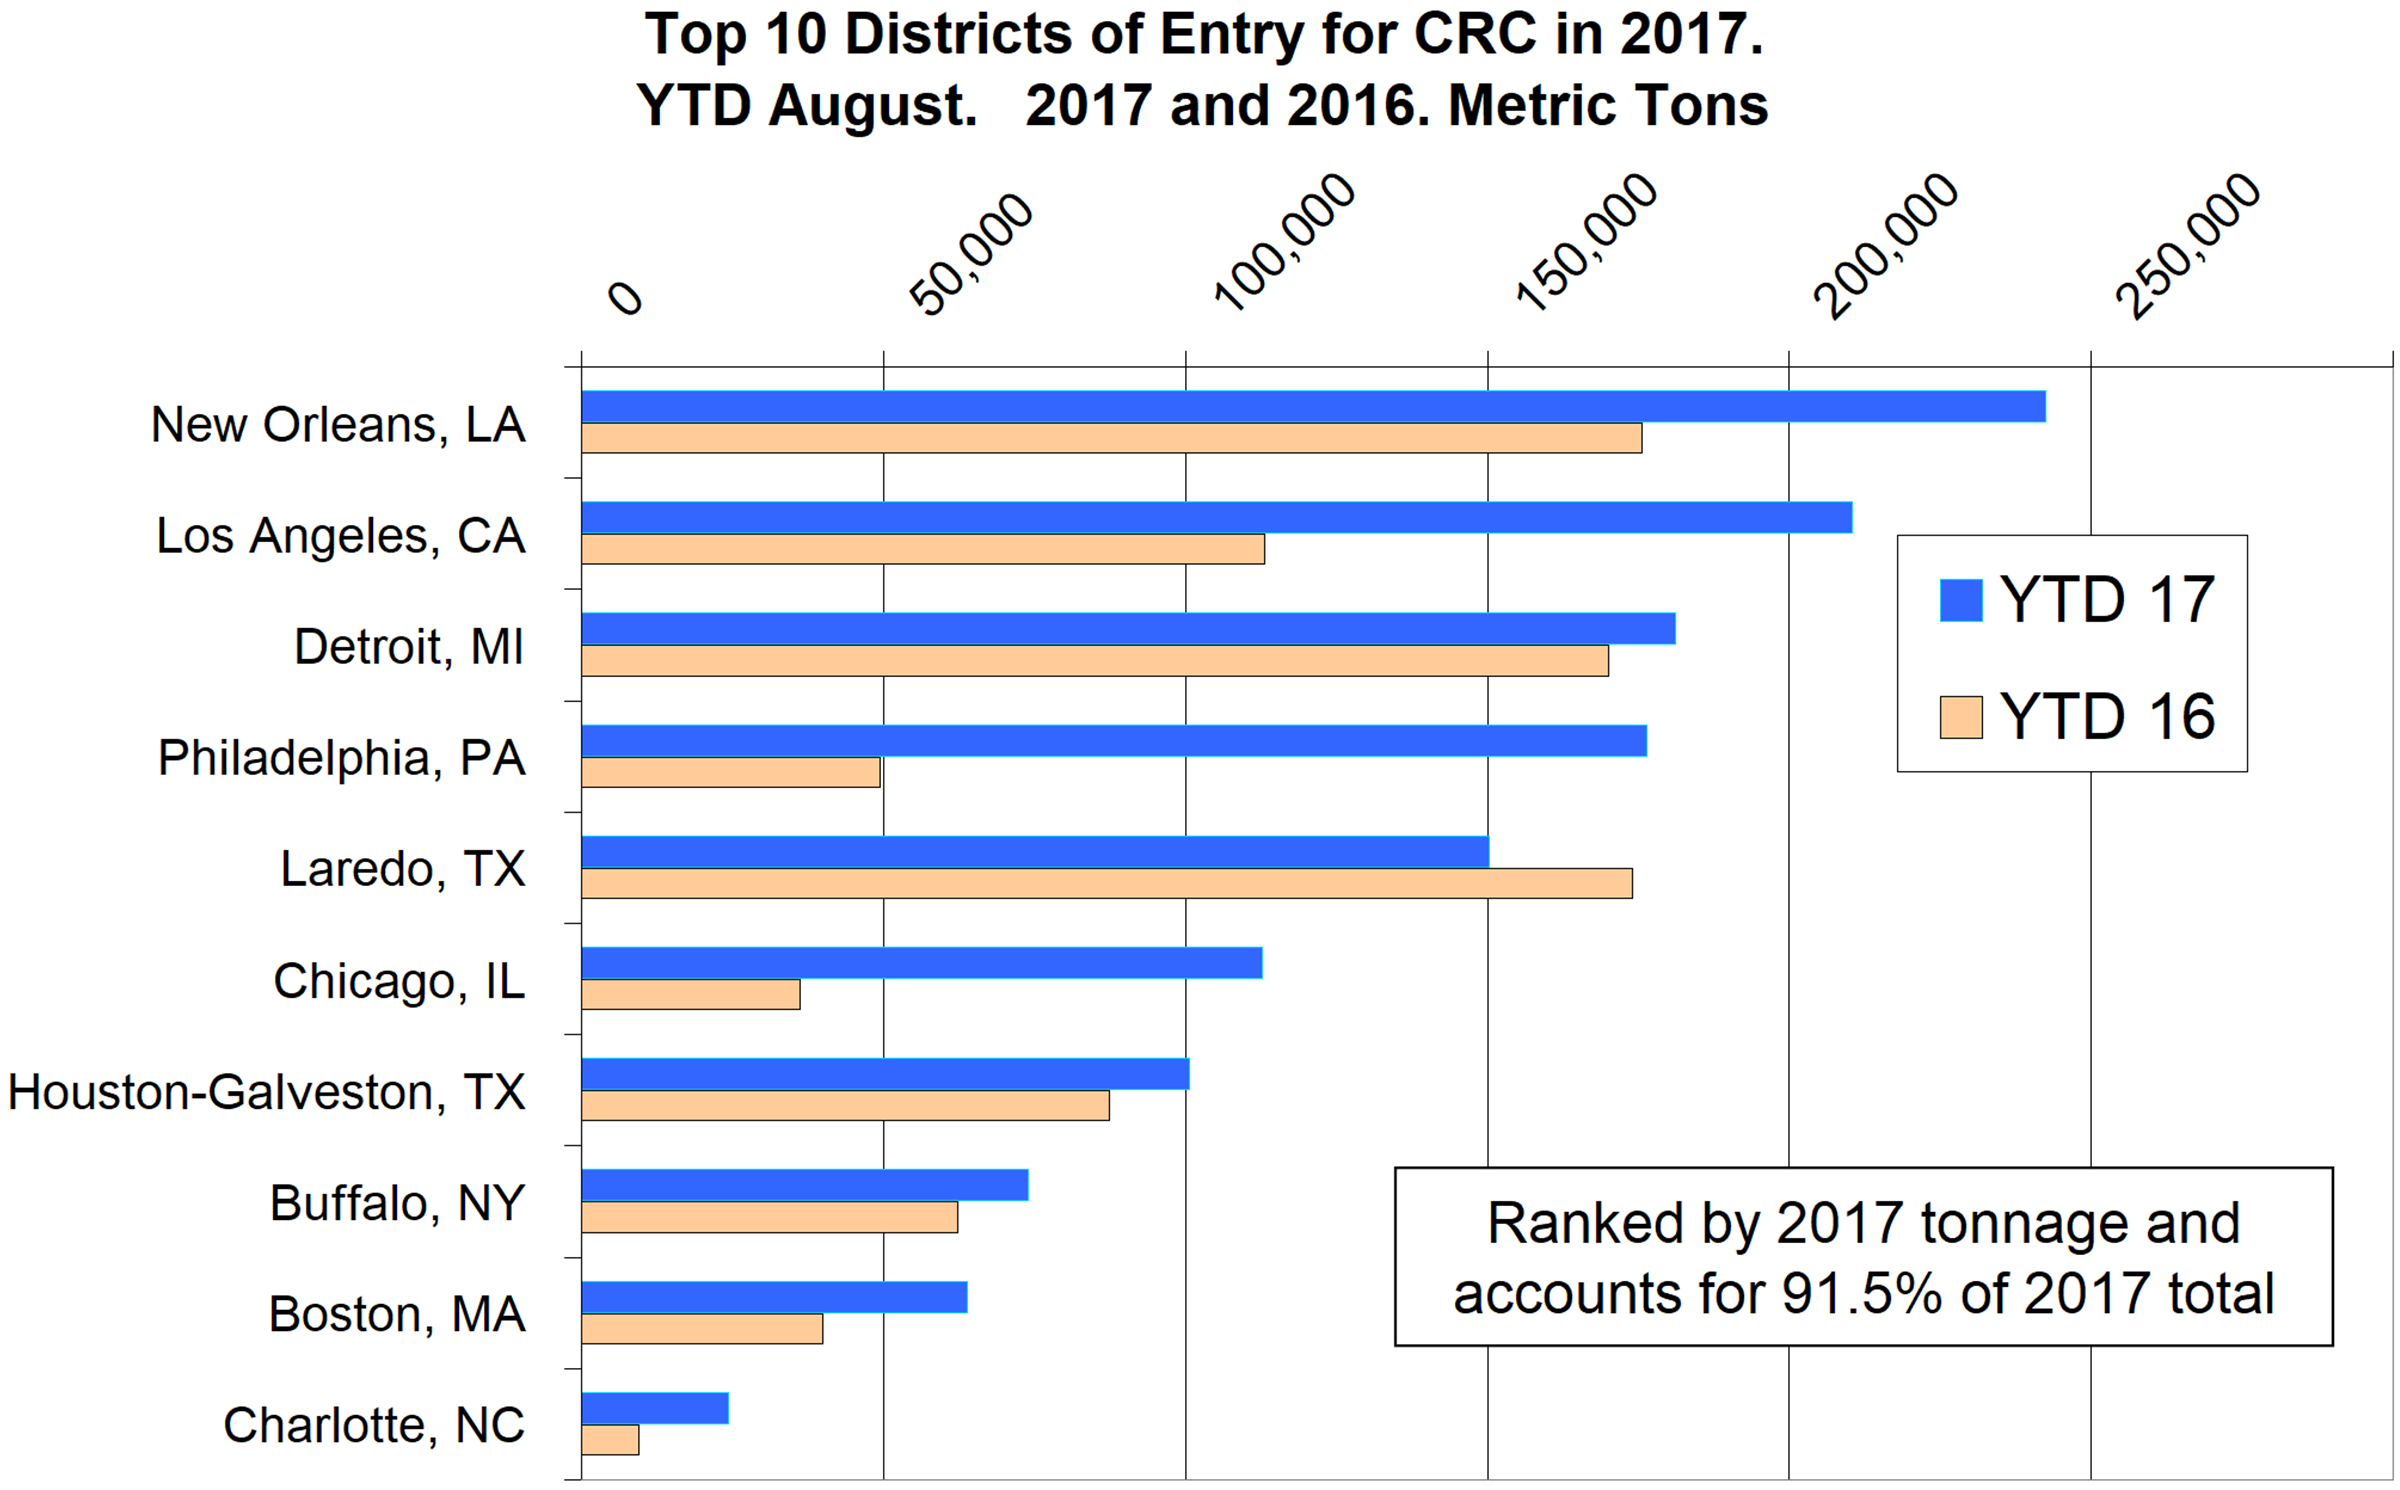
The table included here (click to enlarge) is a small part of the detailed analysis of the CRC tonnage data. The bar graph shows the tonnage of CRC that entered the top 10 districts in YTD August for 2016 and 2017 and is ranked by 2017 tonnage. These 10 districts account for 91.5 percent of the grand total in 2017. New Orleans received the most tonnage through August 2017, followed by Los Angeles, Detroit and Philadelphia.
The data in these detailed reports is compiled from tariff and trade data published by the U.S. Department of Commerce and the U.S. International Trade Commission. Our other import reports are sourced from U.S. Department of Commerce, Enforcement and Compliance, aka the Steel Import Monitoring System. In the development of these reports by district and source country, we have discovered that the SIMA data for HRC and CRC contains some high alloy steels, such as stainless and tool steel, that have been misclassified at the ports. These alloy steels are not included in our detailed reports, which results in a small discrepancy between the two data sets, for CRC in particular and for HRC to a lesser degree.