

Market Data

October 27, 2017
Energy Market: Oil Price Up, But Rig Count Down
Written by Peter Wright
Since Sept. 20, there have only been two days when the spot price of West Texas Intermediate (WTI) closed below $50, which is a positive sign for steel. The prices of oil and natural gas drive the consumption energy-related steel products including oil country tubular goods, pipe fittings and well head equipment, among others. A significant volume of hot rolled coil is used to make welded tubular goods. However, the number of operating rigs exploring for both oil and gas had a recent peak of 958 on July 28 and has since declined to 913 on Oct. 20.
Figure 1 shows historical oil and gas prices since January 2000. The price of WTI has increased for each of the last four months and is $5.80 per barrel above its mid-summer slump, reaching $51.91 on Oct. 23. Our price and inventory data come from the Energy Information Administration (EIA).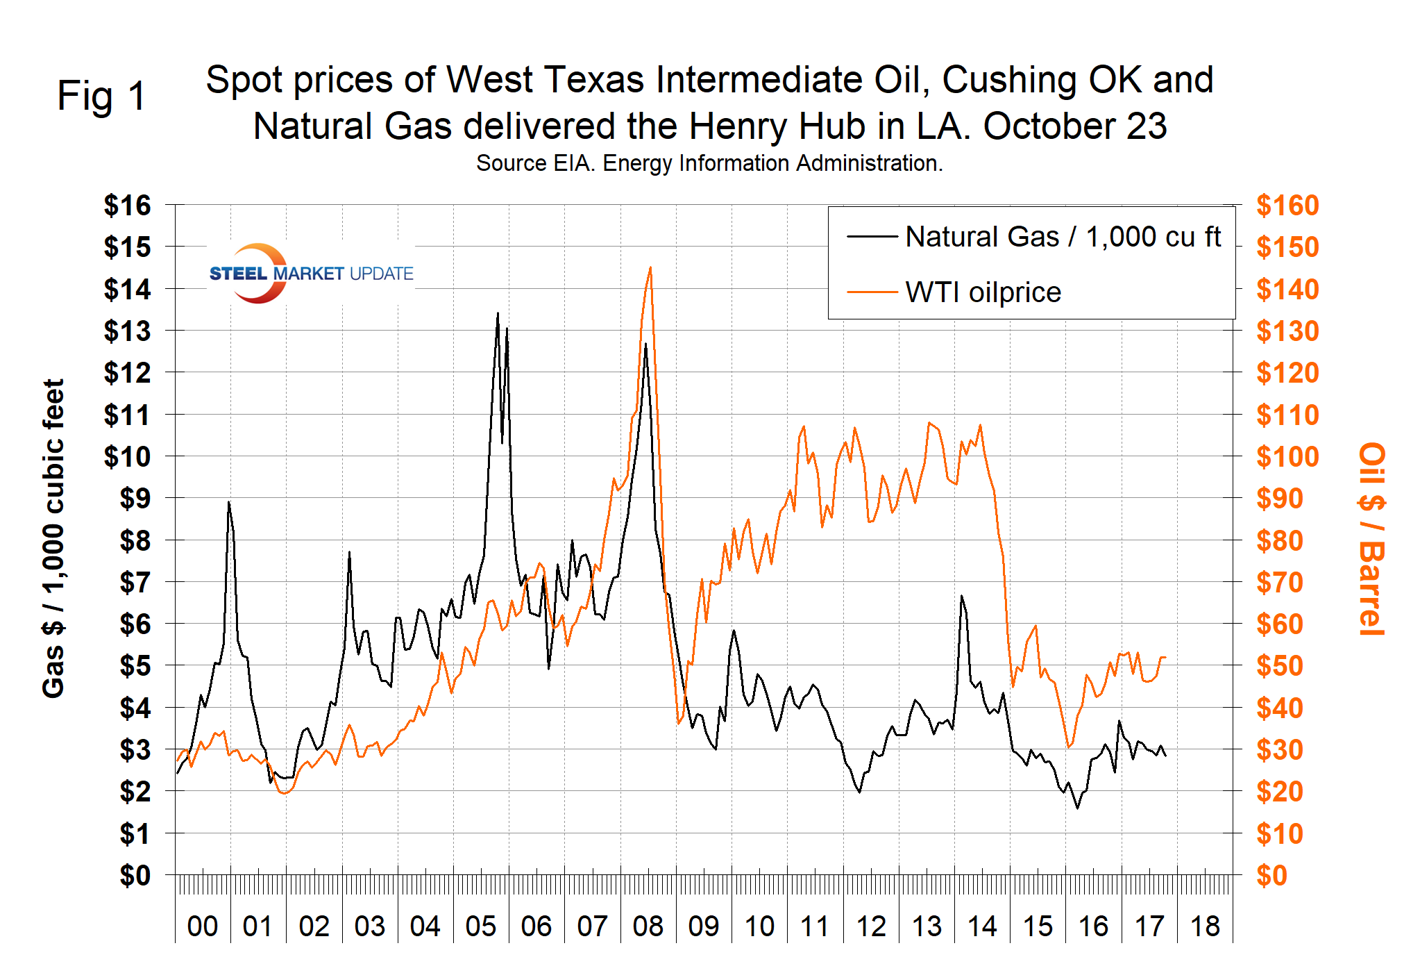
Since March 24, U.S. stocks of crude oil, excluding the strategic petroleum reserve have declined from 534 million barrels to 457 million on Oct. 20, a reduction of 14.4 percent. Stocks are still well above the historical norm (Figure 2).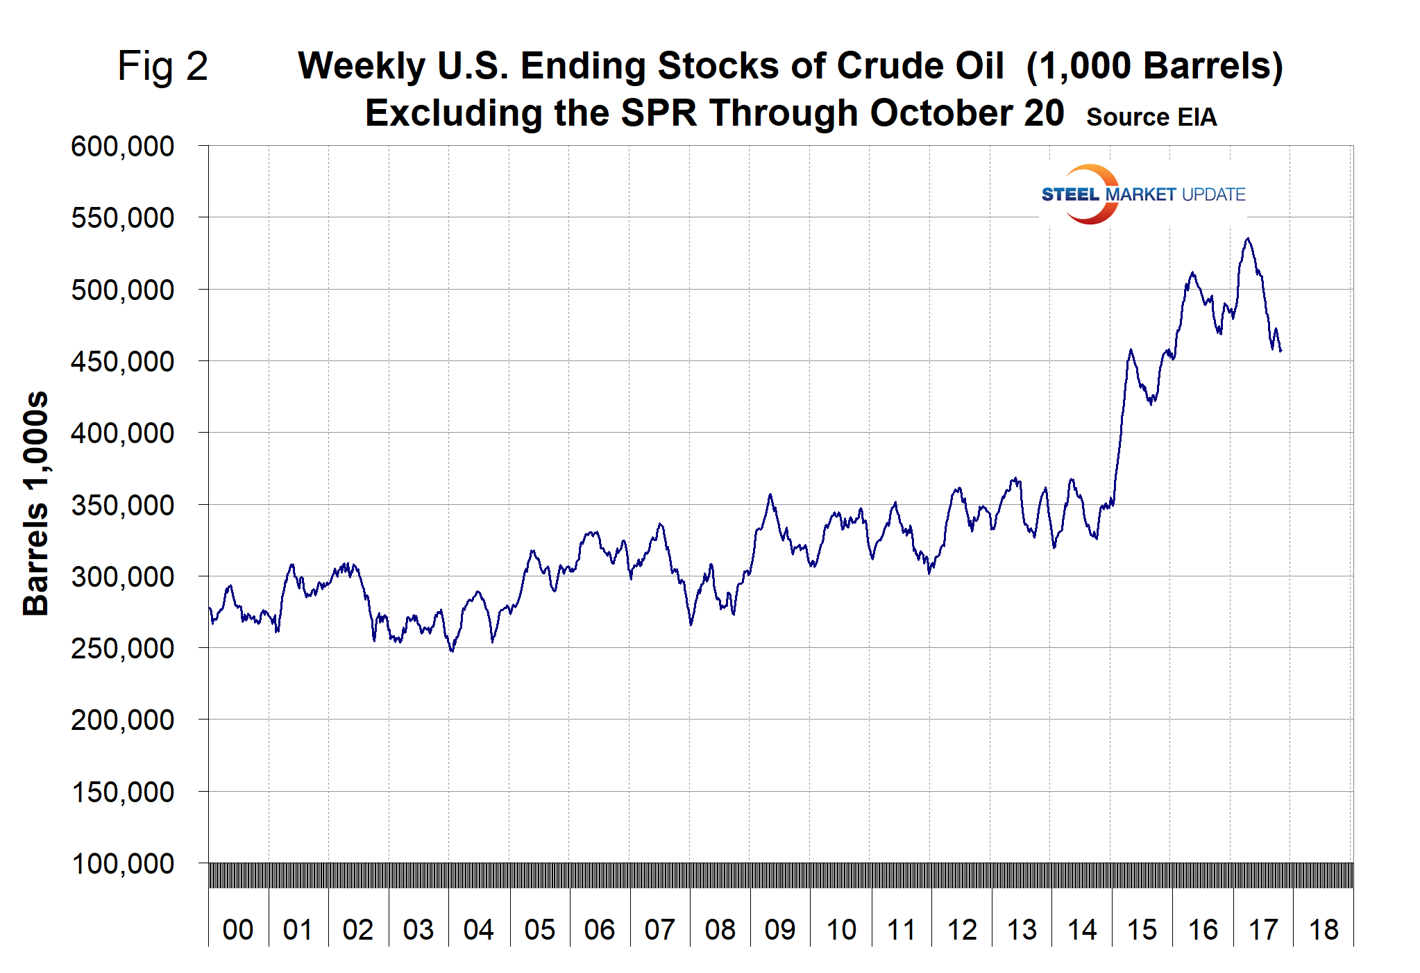 The price of natural gas on Oct. 20 at the Henry Hub in Louisiana was $2.84 per 1,000 cu. ft. This was 25 cents lower than in our September update, but the same as in August. On Oct. 25, Blue Quadrant Capital Management wrote: “The dynamic of the U.S. natural gas market is set to change with a marked upward shift in demand likely over the next two years as LNG export and pipeline export capacity to Mexico ramp up. Recent analysis from RBN Energy suggests that overall natural gas demand will increase by some 13 Bcf/day by 2022, led by the aforementioned increase in LNG exports. Natural gas consumption in 2016 averaged about 75 Bcf/day. If we factor in the anticipated additional demand from other LNG export facilities due to commence operations in 2018 and 2019 (8 Bcf/day), as well as penciling in additional increase of 2 Bcf/day in exports to Mexico, we arrive at a conservative average daily demand figure of 85 Bcf by the end of 2019. This is a conservative figure because it does not take into account the potential for growth in underlying demand for gas-fired electricity, nor does it take into account the potential for more severe climatic conditions.”
The total number of operating rigs in the U.S. on Oct. 20 was 913, which was a decrease from a recent peak of 958 on July 28. This month, we have developed a new chart included as Figure 3 that we think does a better job of illustrating changes in the weekly count.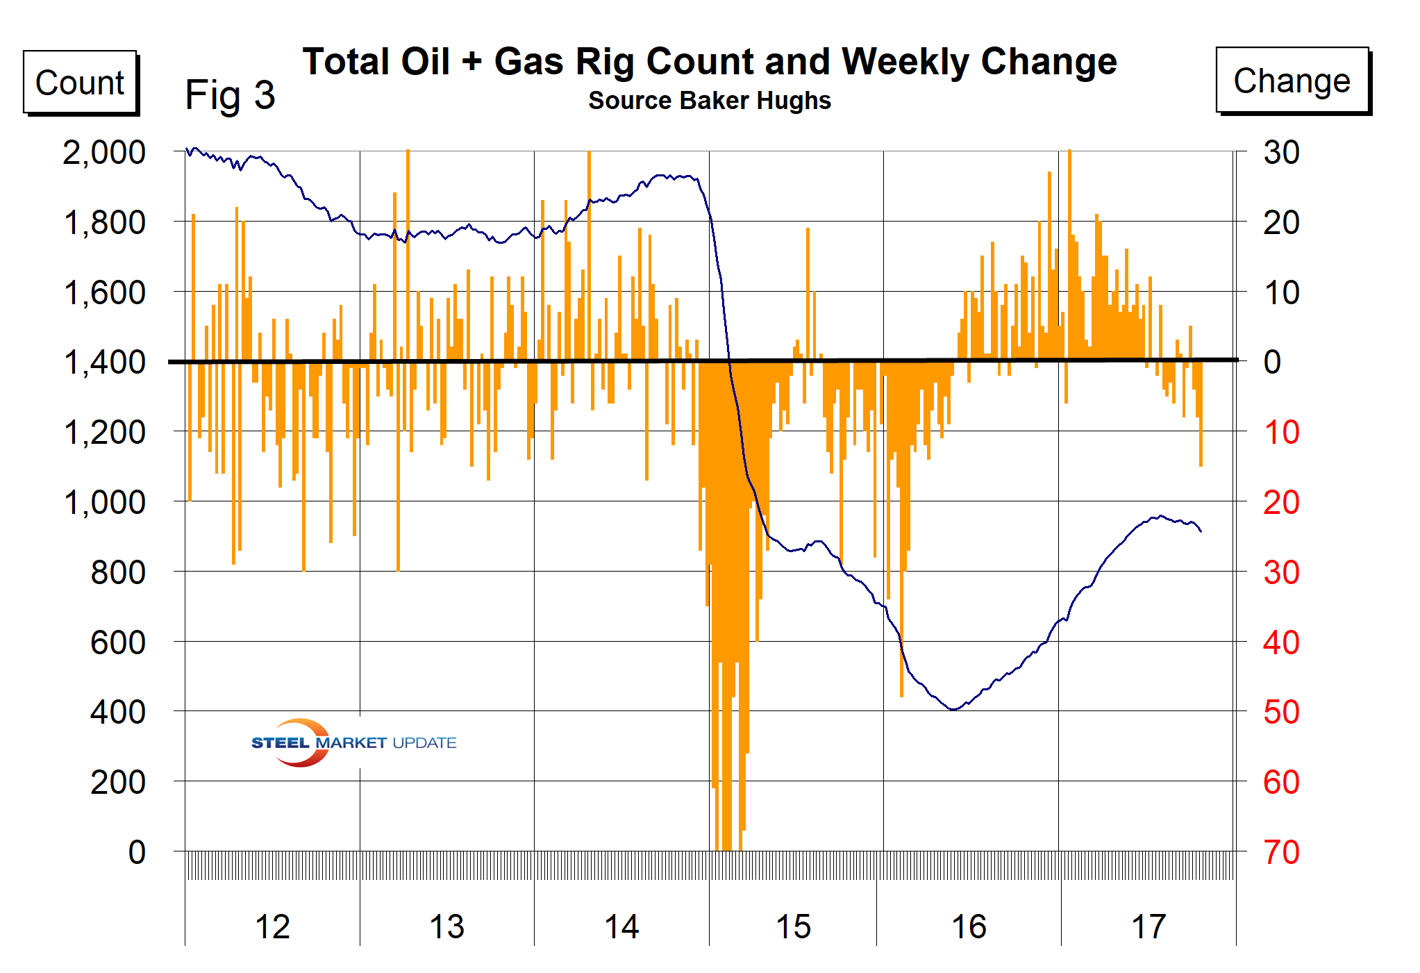 In the week ending Oct. 20, the count fell by 15, which was the largest weekly decline since Feb. 19 last year. The number of operating rigs has declined for eight of the last 12 weeks. The oil rig count had a low point of 316 on June 27 last year, increased to 768 on Aug. 11 and declined to 736 on Oct. 20. No doubt Hurricane Harvey played a part in this decline, but we have no data to substantiate that assumption except that most of the decline occurred in Texas. The U.S. gas rig count rose from its low point of 81 on Aug. 5 last year to 192 on July 28 and was at 177 on Oct. 20. The year-over-year growth rate of U.S. total rigs was 65.1 percent in the latest data.
Figure 4 shows the Baker Hughes U.S. Rotary Rig Counts for oil and gas equipment in the U.S. (explanation below).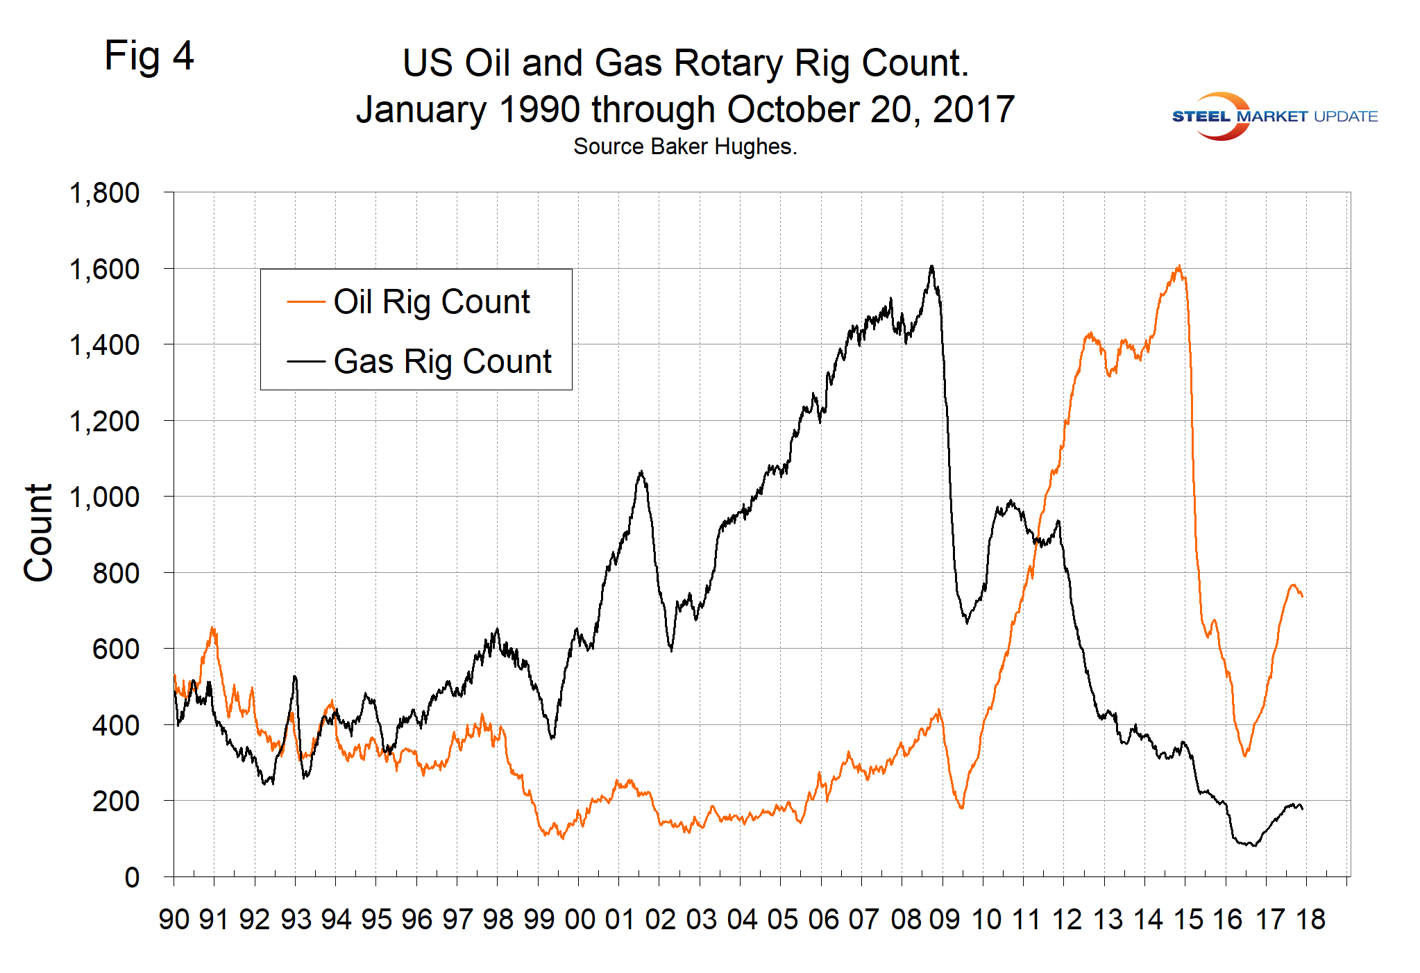 We came across an article by Donovan Jones, CEO of Venturedeal.com this month, which is a harbinger of things to come. He reported that energy firm Royal Dutch Shell plc has agreed to acquire electric vehicle charging network company NewMotion for an undisclosed amount. NewMotion has created a large network of over 50,000 charge points with 100,000 charge cards throughout Europe. Shell has a goal of increasing its fuel station sales from electric vehicles and is investing $1 billion per year through its New Energies division. Through the NewMotion deal, Shell is positioning itself to take advantage of the expected growth of electric vehicles and electrical energy usage.
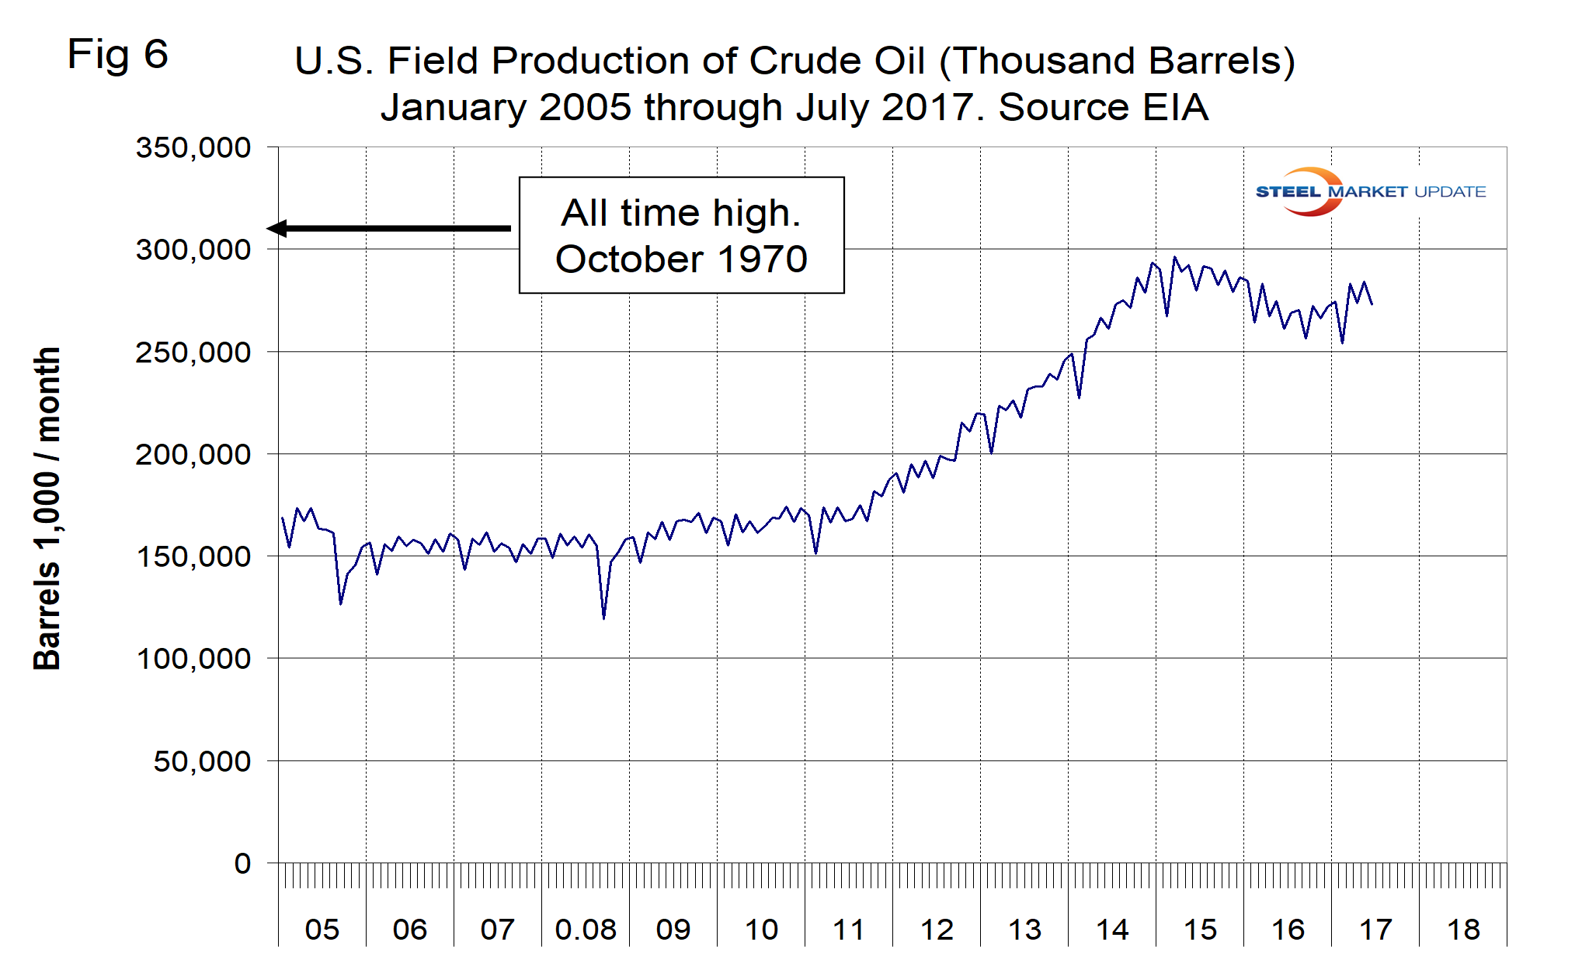
On a regional basis in the U.S., the big three states for operating rigs are Texas, Oklahoma and North Dakota. Figure 5 shows the land rig count in those states since 2000. It also shows that non-conventional drilling in North Dakota was down by 73 percent from its heyday in late 2014. This is not as bad as it sounds because previously drilled and capped wells are being put back on stream.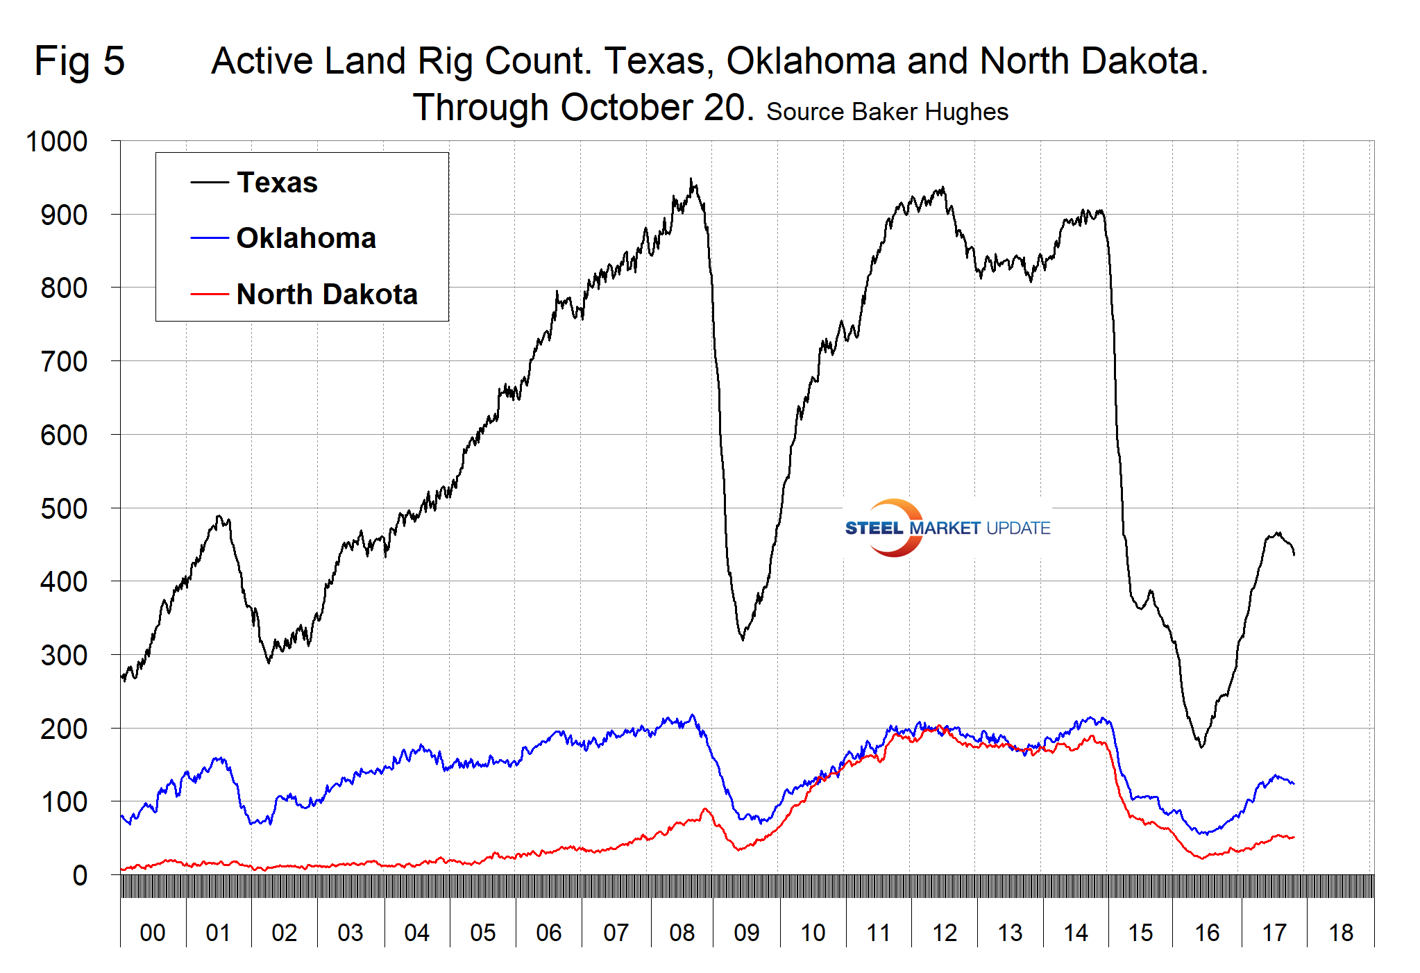 Figure 6 illustrates the U.S. oilfield production of crude from January 2005 through July 2017 with an indication of the all-time high of 310 million barrels that occurred in October 1970. Production in July 2017 was 273 million barrels.
 Baker Hughes Rotary Rig Count: This is a weekly census of the number of drilling rigs actively exploring for or developing oil or natural gas in the United States. Rigs are considered active from the time they break ground until the time they reach their target depth and may be establishing a new well or sidetracking an existing one. The Baker Hughes Rotary Rig count includes only those rigs that are significant consumers of oilfield services and supplies.


