

Market Data

October 27, 2017
Manufacturing Indicators Positive for Rest of 2017
Written by Peter Wright
Economic indicators of manufacturing activity are still healthy overall and portend well for the balance of this year.
This report summarizes seven data sources that describe the state of manufacturing in the U.S. We have reported on most of these separately in our Steel Market Update publications, and therefore will be brief in this summary. We don’t expect these data sources to all point in the same direction. Our intention in summarizing them in one document is to provide a consensus of the state of this critical steel consumption sector. Based on AISI estimates of steel mill shipments by market classification, almost 50 percent of the steel consumed in the U.S. is manufacturing oriented. This breaks down to about 27 percent in ground transportation, 9 percent in machinery and equipment, 5 percent in appliances, 4 percent in defense and about 4 percent in containers.
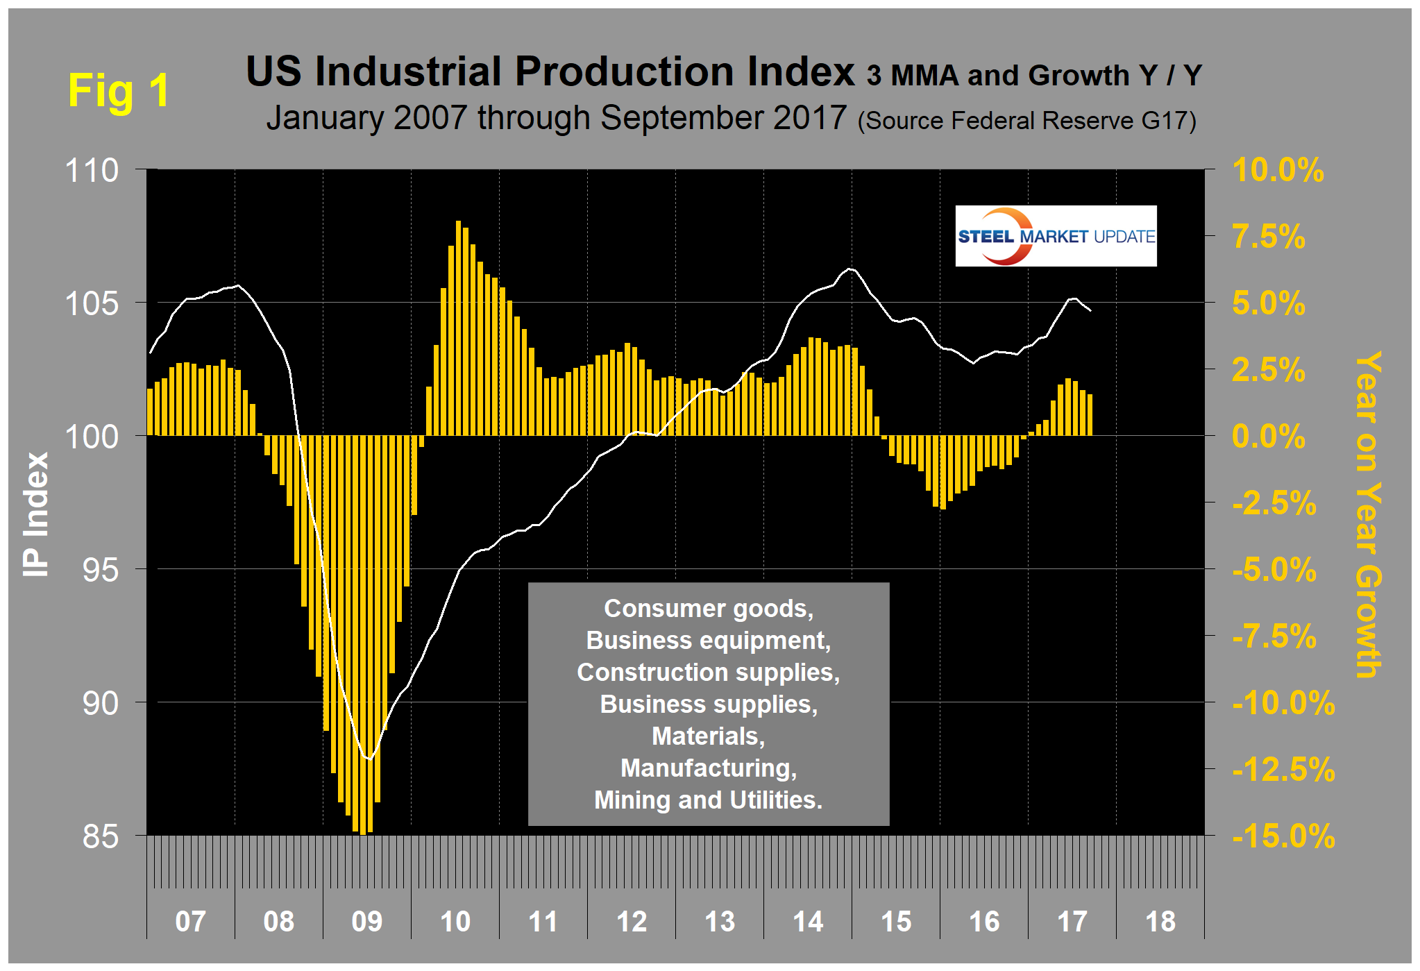
![]() The Industrial Production Index: Figure 1 shows the IP index since January 2007 with the year-over-year growth. The three-month moving average (3MMA) had negative growth every month from October 2015 through December 2016 as shown by the brown bars in Figure 1. January this year was the first month of positive growth in the 3MMA since August 2015. Growth improved in each of the 10 months through June 2017 from negative 1.24 percent in September last year to positive 2.12 percent in June, before falling back to 1.53 percent in September. KeyBanc Capital Markets reported:Industrial Production in September 2017 grew 1.6 percent year over year. The sequentially stronger September reading was primarily driven by a +1.3 percent year-over-year gain in Mining in Other Durables (+0.5 percent), Machinery (+0.4 percent) and Nondurables (+0.2 percent). These gains were offset by year-over-year declines in Utilities (-0.5 percent) and Automotive (-0.2 percent), the latter of which has declined for three consecutive months. On a month-over-month basis, we note the continued effects of Hurricane Harvey, and to a lesser degree of Hurricane Irma, combined to hold down the growth in total production in September by 0.25 percent. The Federal Reserve notes that for the third quarter as a whole, IP fell 1.5 percent at an annual rate, though excluding the effects of the hurricanes, the index would have risen at least 0.5 percent.
The Industrial Production Index: Figure 1 shows the IP index since January 2007 with the year-over-year growth. The three-month moving average (3MMA) had negative growth every month from October 2015 through December 2016 as shown by the brown bars in Figure 1. January this year was the first month of positive growth in the 3MMA since August 2015. Growth improved in each of the 10 months through June 2017 from negative 1.24 percent in September last year to positive 2.12 percent in June, before falling back to 1.53 percent in September. KeyBanc Capital Markets reported:Industrial Production in September 2017 grew 1.6 percent year over year. The sequentially stronger September reading was primarily driven by a +1.3 percent year-over-year gain in Mining in Other Durables (+0.5 percent), Machinery (+0.4 percent) and Nondurables (+0.2 percent). These gains were offset by year-over-year declines in Utilities (-0.5 percent) and Automotive (-0.2 percent), the latter of which has declined for three consecutive months. On a month-over-month basis, we note the continued effects of Hurricane Harvey, and to a lesser degree of Hurricane Irma, combined to hold down the growth in total production in September by 0.25 percent. The Federal Reserve notes that for the third quarter as a whole, IP fell 1.5 percent at an annual rate, though excluding the effects of the hurricanes, the index would have risen at least 0.5 percent.
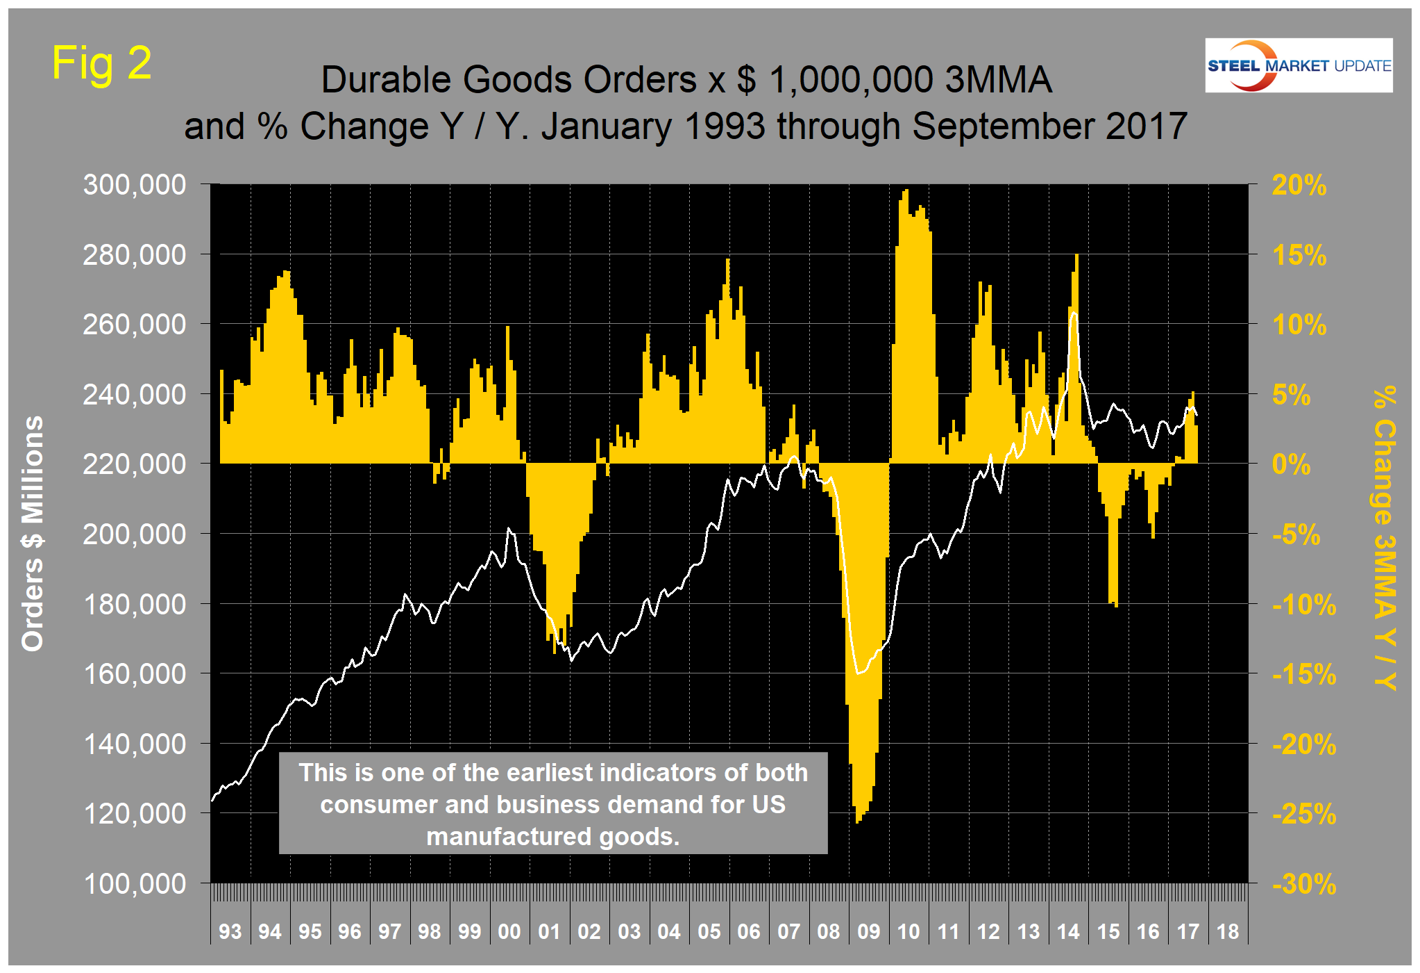
New Orders for Durable Goods: The U.S. Census Bureau announced last week that new orders for manufactured durable goods in September increased by $5.0 billion or 2.2 percent to $238.7 billion. Economy.com reported “Despite any disruptions caused by recent hurricanes, U.S. factories are humming, according to recent data, including those in Wednesday’s advance durable goods report. Durable goods orders posted the best gain since June. Encouragingly, the gains have become more broad-based, placing orders for most manufactured goods above their year-ago levels. Moreover, that includes the core capital goods segment (capital goods, excluding aircraft), which carries important implications for productivity growth. Productivity gains have disappointed in the last decade.”
Figure 2 shows the 3MMA of monthly orders for durable goods since January 2010 with the percent change year over year. March this year was the first month since April 2015 to have positive year-over-year growth. There has been an improving trend since August 2015 with a positive surge in the most recent data for June through September this year.
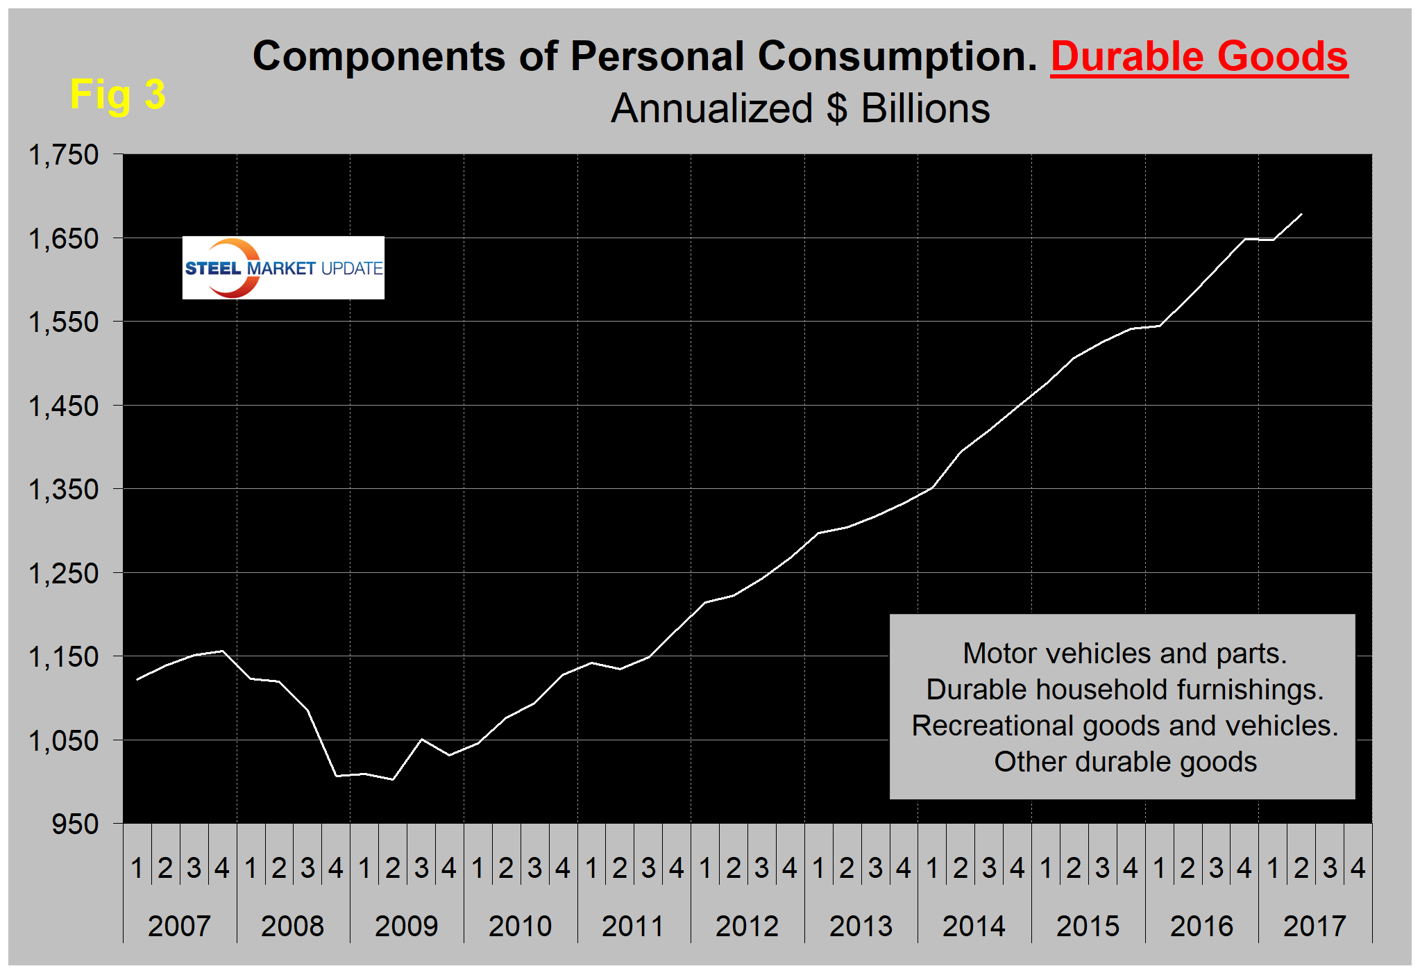
The Durable Goods Portion of GDP: The third estimate of Q2 GDP confirmed the second estimate of a 3.1 percent growth rate. A sub-component of the quarterly data is durable goods, which is part of the personal consumption calculation. It therefore contains no military hardware or civil aircraft data. This is shown in Figure 3 and, presumably because of the exclusions just mentioned, looks nothing like Figure 2. With the exception of one quarter, which was Q1 2017, the durable goods portion of GDP saw positive growth every quarter since Q2 2011.
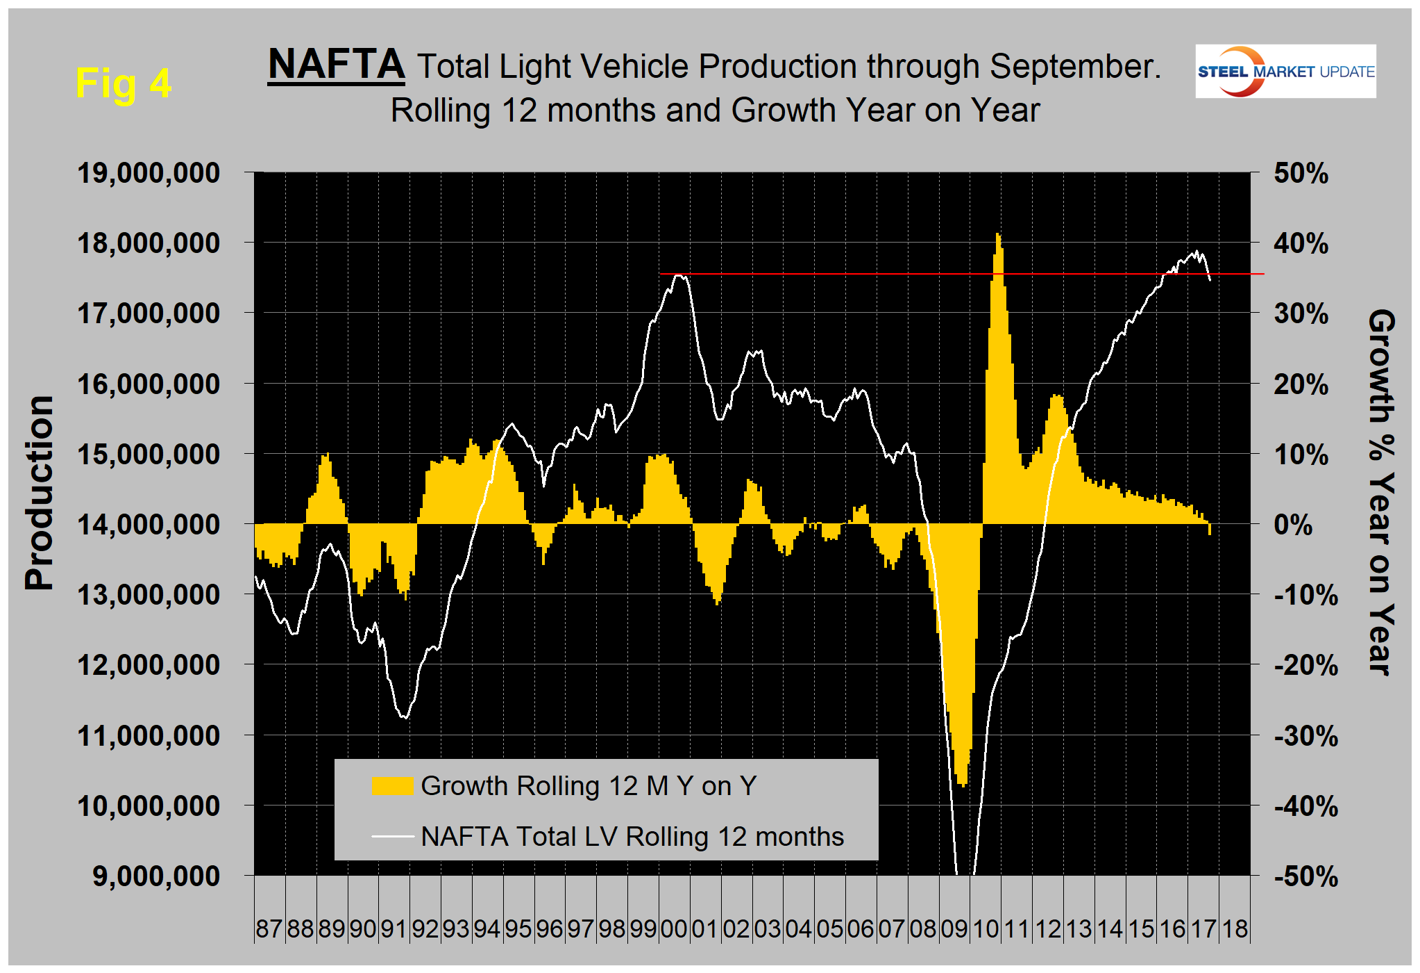
Light Vehicle Production in NAFTA: On a rolling 12-months basis year over year through September, LV production in NAFTA decreased by 1.5 percent, which was the first decrease since May 2010. There has been a very gradual slowdown in growth for the last three years as indicated by the brown bars in Figure 4. The data source is Ward’s Automotive. Up until this latest data, production was higher than the previous all-time high every month since early 2016, but that has now changed. We understand that the main hang-up in the NAFTA negotiations revolves around auto parts manufacture and final point of assembly. There is a huge movement of components and sub-assemblies in both directions across the southern border, therefore it is not known whether the Ward’s data exaggerates or deflates the national differentials.
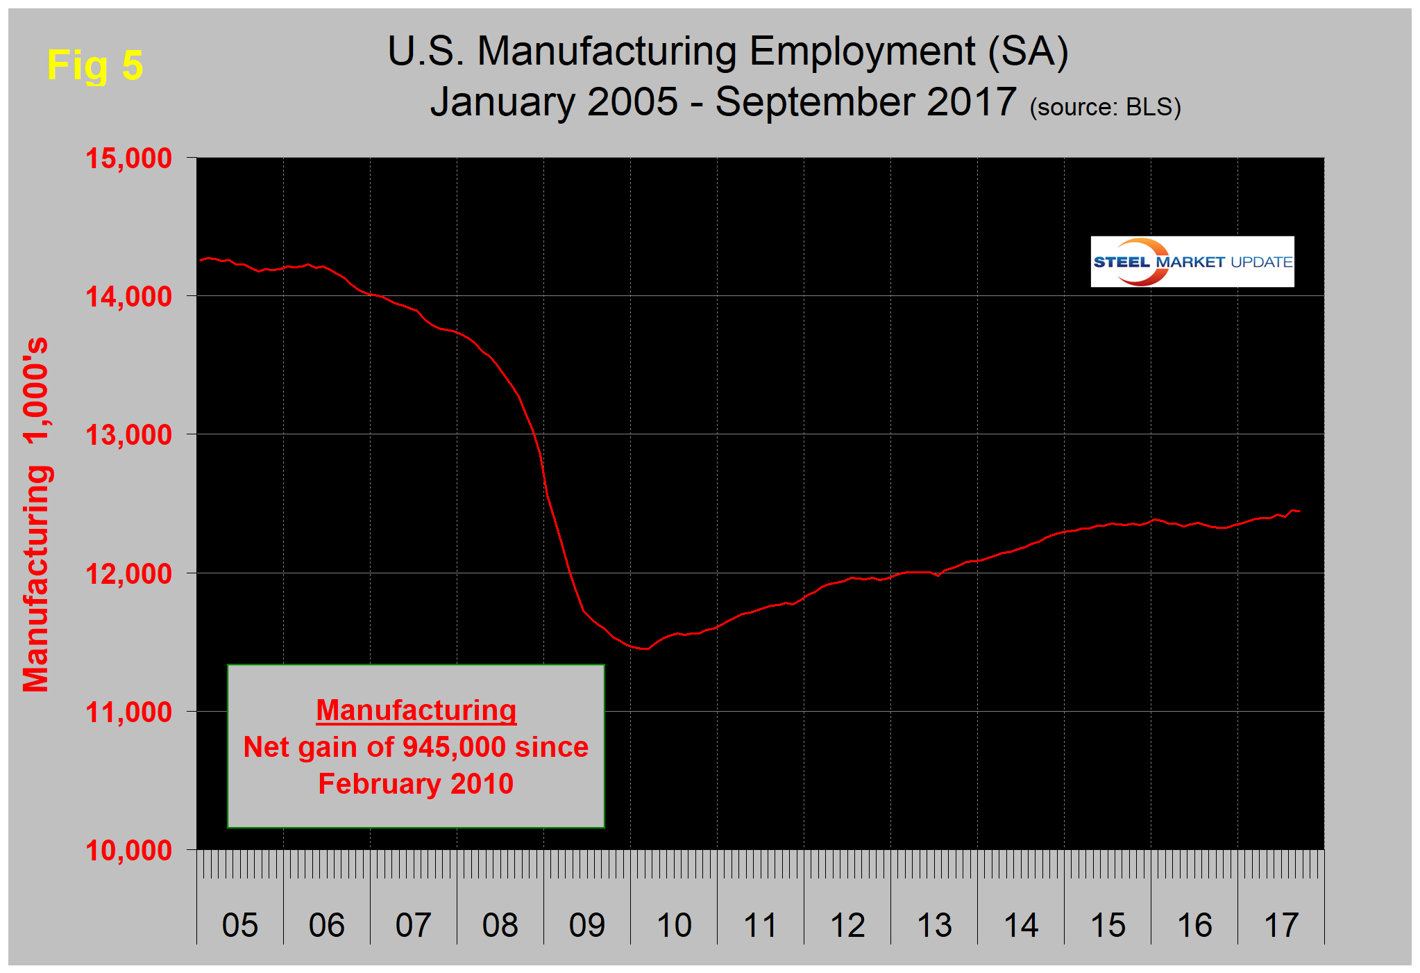
Manufacturing Employment: Manufacturing employment dived during the recession and gradually improved from the spring of 2010 through 2014. Growth was flat in 2015 and declined slightly in 2016 when 23,000 jobs were lost in the year as a whole. There was a turnaround in the first nine months of this year when 104,000 manufacturing jobs were created (Figure 5). The motor vehicles and parts subcomponent of manufacturing employment has lost 3,000 jobs this year.
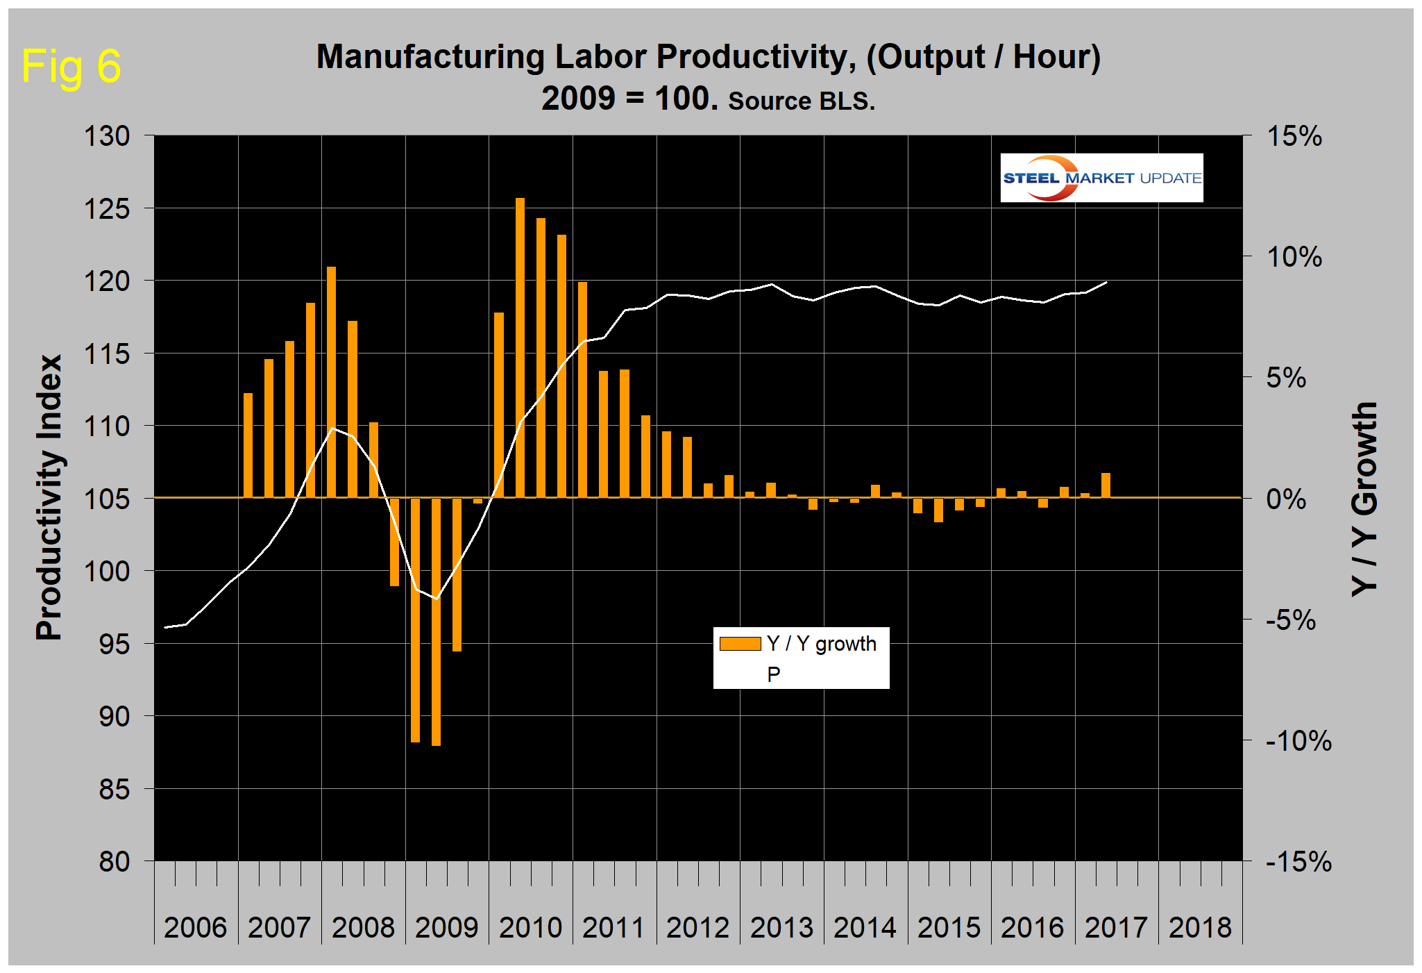
Manufacturing Productivity: The Bureau of Labor Statistics reports that in Q2 2017 manufacturing productivity improved by 1.0 percent year over year (Figure 6). This was the highest growth rate since Q4 2012. The bad news is that output per hour is still at the same level as it was in Q2 2013. The BLS data file has not yet been updated for Q3.
The ISM Manufacturing Index: The Institute for Supply Management’s manufacturing index is a diffusion index. ISM states: “Diffusion indexes have the properties of leading indicators and are convenient summary measures showing the prevailing direction of change and the scope of change. An index value above 50 percent indicates that the manufacturing economy is generally expanding; below 50 percent indicates the opposite.” Figure 7 shows the 3MMA of the ISM index from January 1997 through September 2017 with an improving trend since January 2016. In September, the 3MMA of the index at 58.63 was the highest since April 2011.
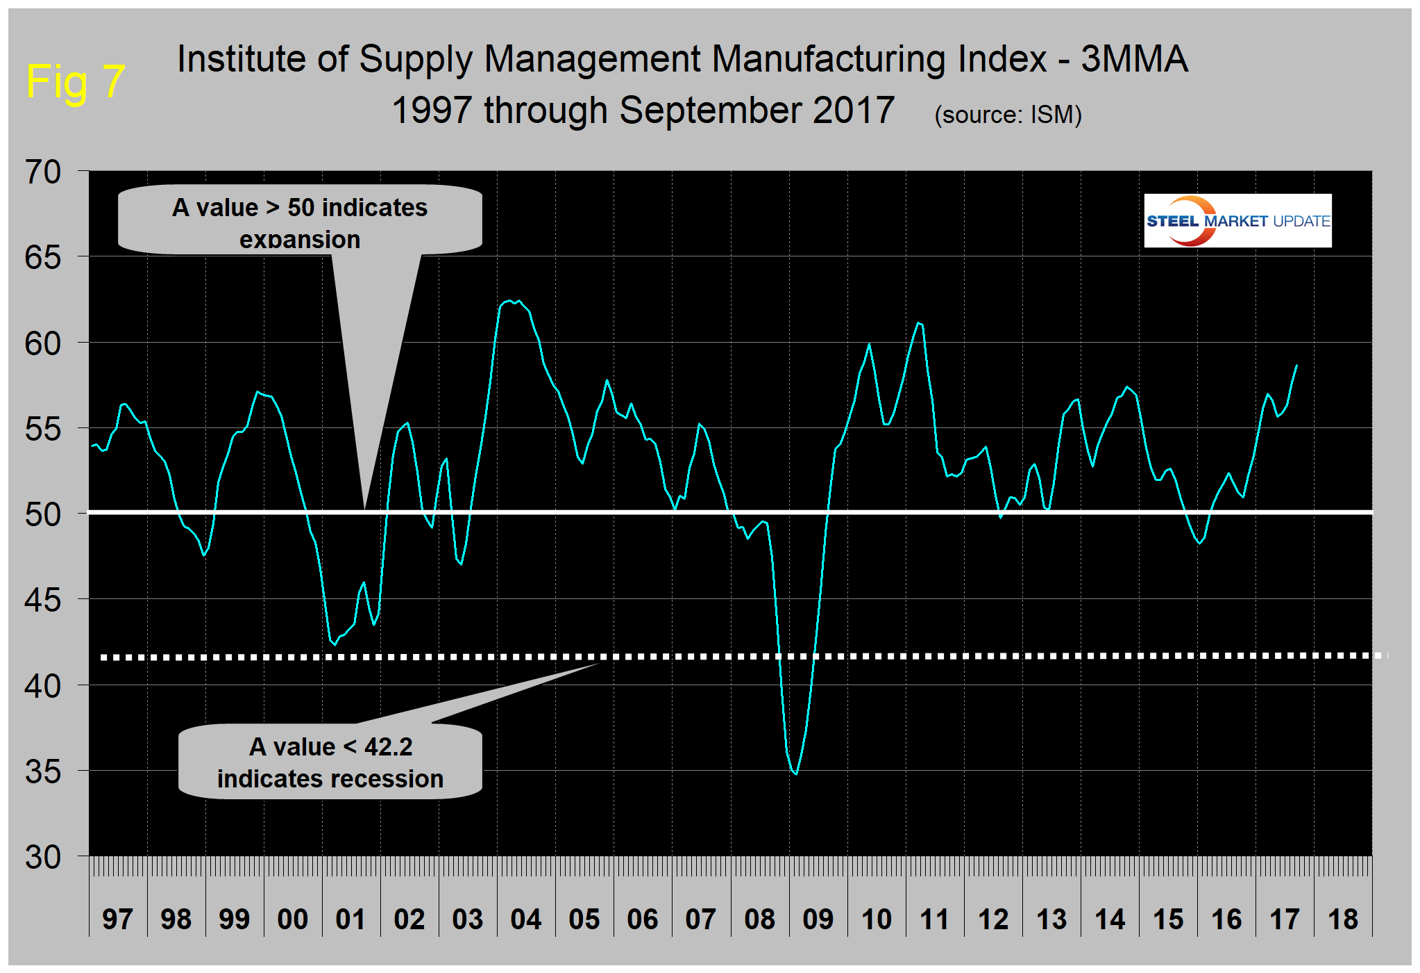
Moody’s had this to say about the September result: “U.S. manufacturing conditions are improving as the global economy has strengthened and the U.S. dollar has depreciated. The ISM manufacturing index increased from 58.8 in August to 60.8 in September. This was better than our forecast of 58.7 and consensus expectations for 58. The details were solid, as new orders, production and employment rose.”
SMU Comment: The ISM index, which we give the most credence, is at its strongest level since April 2011 and signaling expansion. This is the only leading indicator examined in this update. Auto assemblies and supplier industries are slowing in NAFTA and the U.S. and Canada are losing share to Mexico. Manufacturing has added 104,000 jobs this year through September and the employment component of the ISM index has had positive growth in each of the last 12 months. The industrial production index and new orders for durable goods have positive growth. Therefore, we conclude that the balance of these seven measures are positive and portend well for the remainder of 2017.


